A real session on the terminal: Friday 2 October
The first series built the machine. Where the exposure comes from, what a desk has to hold against it, what a wall is made of, and the three different reasons that holding changes while you watch — all of it mechanism, none of it a chart.
This one starts the second series, and the second series does something else: it puts the machine on a real session and asks what it was good for. No new mechanism from here on. Same parts, in front of a day that has already happened.
Friday, the second of October. The screen is what a subscriber had in front of them at a quarter past nine in the morning, Central European time — a quarter past three in New York. The overnight session has already run nine hours. Asia is behind us, Europe is opening, and the analysis has just been published. The lines on the chart are the ones it drew.
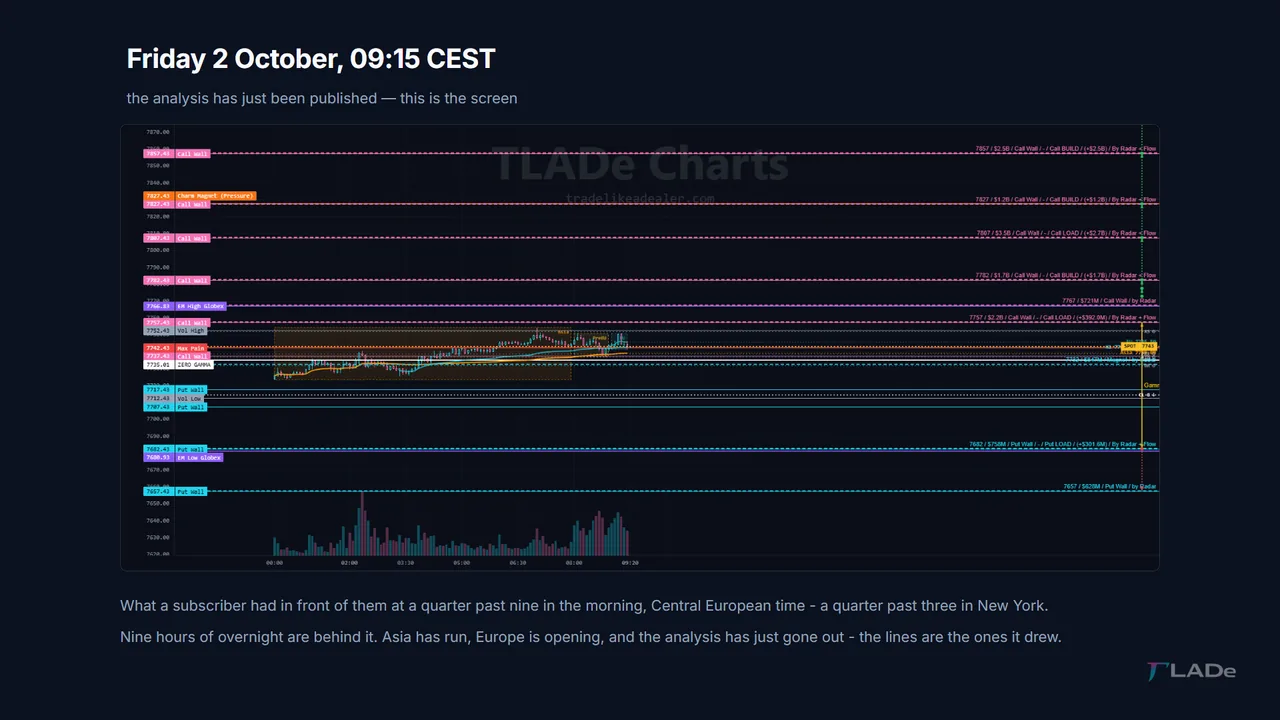
From here on, nothing the map says was decided after the session ran.
How many GEX levels to draw, and why ten is arbitrary
The chain lists hundreds of strikes, five points apart. Draw them all and you have not drawn a map, you have drawn graph paper — a support or a resistance every five points, which is the same as none.
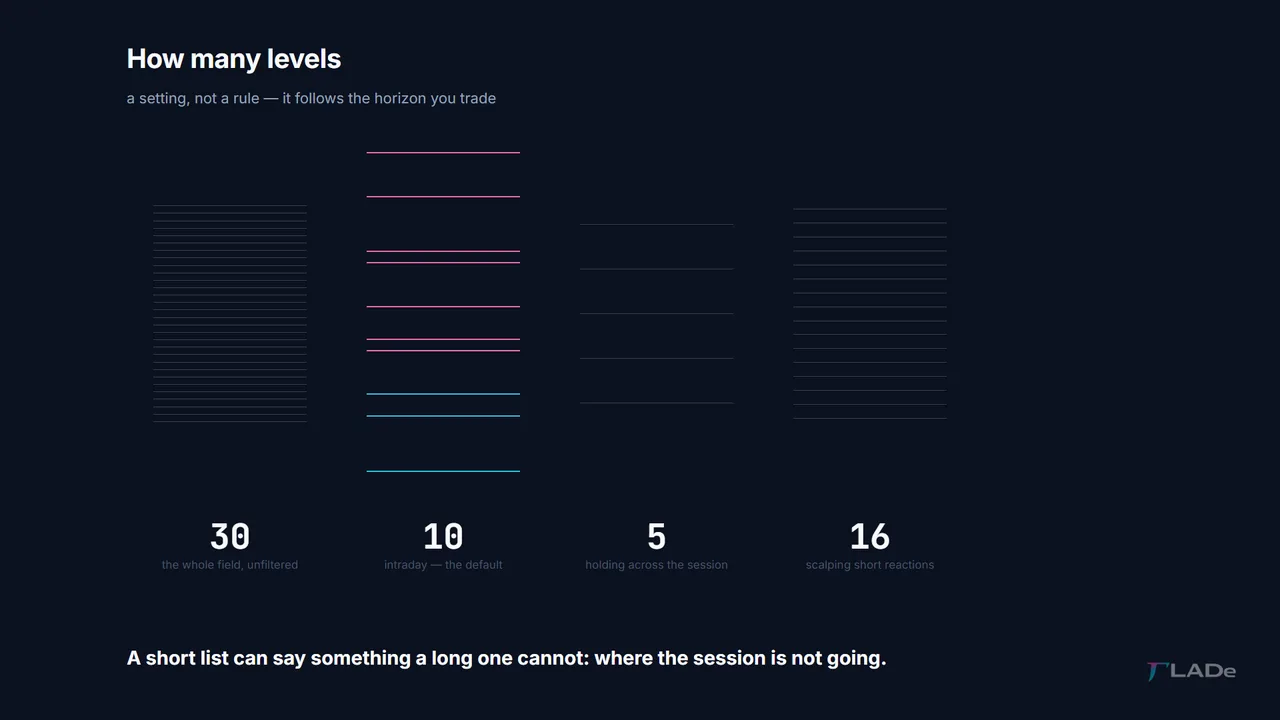
So you keep a few, and how many is a setting. This session is read with ten, and ten is arbitrary. It is the default because it is a reasonable compromise for intraday work, not because anything in the market says ten. Fewer is quieter, more is finer, and the number that suits you follows the horizon you trade rather than anything we decided.
The one we would not recommend is thirty, unless you want the whole field in front of you and intend to do the filtering yourself. At thirty you are back to the grid.
Whatever you pick, the point of picking is this: a short list can say something a long one cannot, which is where the session is not going. Hold that sentence. It is the one this day settles.
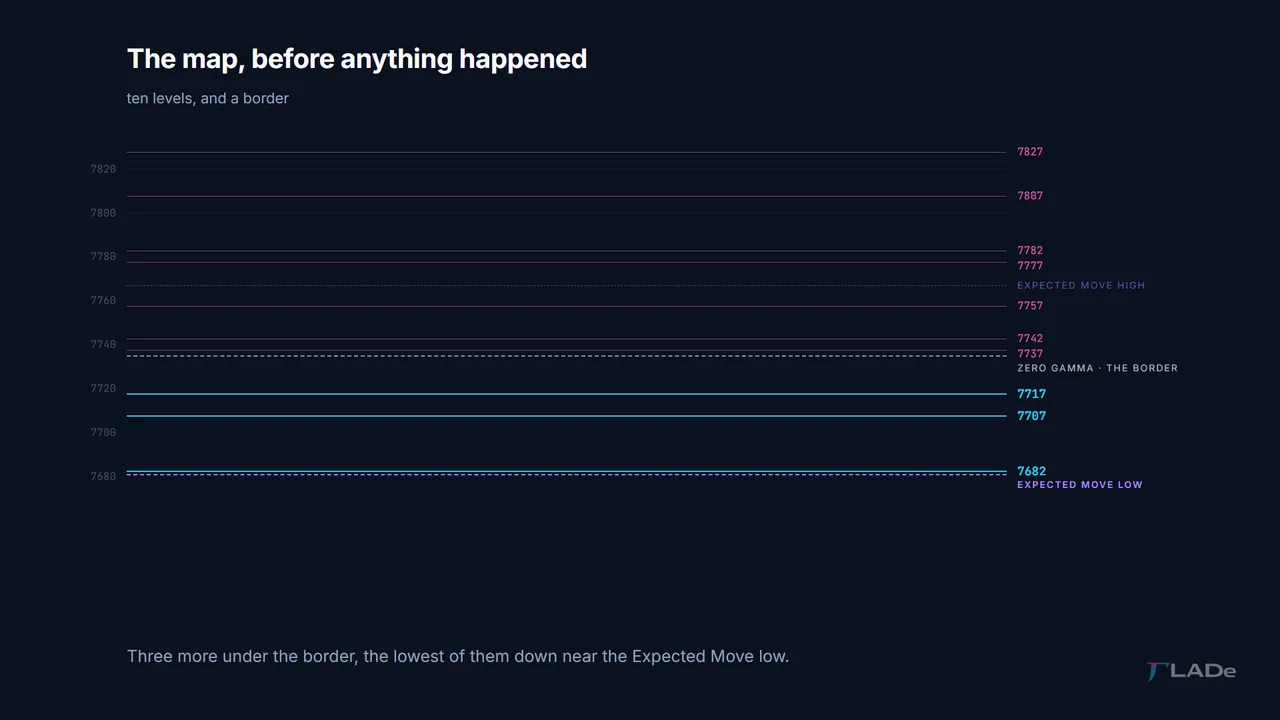
What the level map said before the session
Above the price, five of the ten. The nearest obstacle sits just overhead, at 7757 — remember that number, it comes back more than once. Above it the Expected Move high, then a pair close together, and then the heaviest strike on the whole board: three point four billion dollars of gamma, about sixty points up, at 7807. Remember that one as well. One more beyond it, and that is the ceiling of the map.
Below the price, the other five. Two of them sit just underneath, and then the Zero Gamma. That line is a border rather than a wall: above it the hedging leans against the move, below it the hedging runs with the move. Underneath the border, three more levels, the lowest of them down near the Expected Move low.
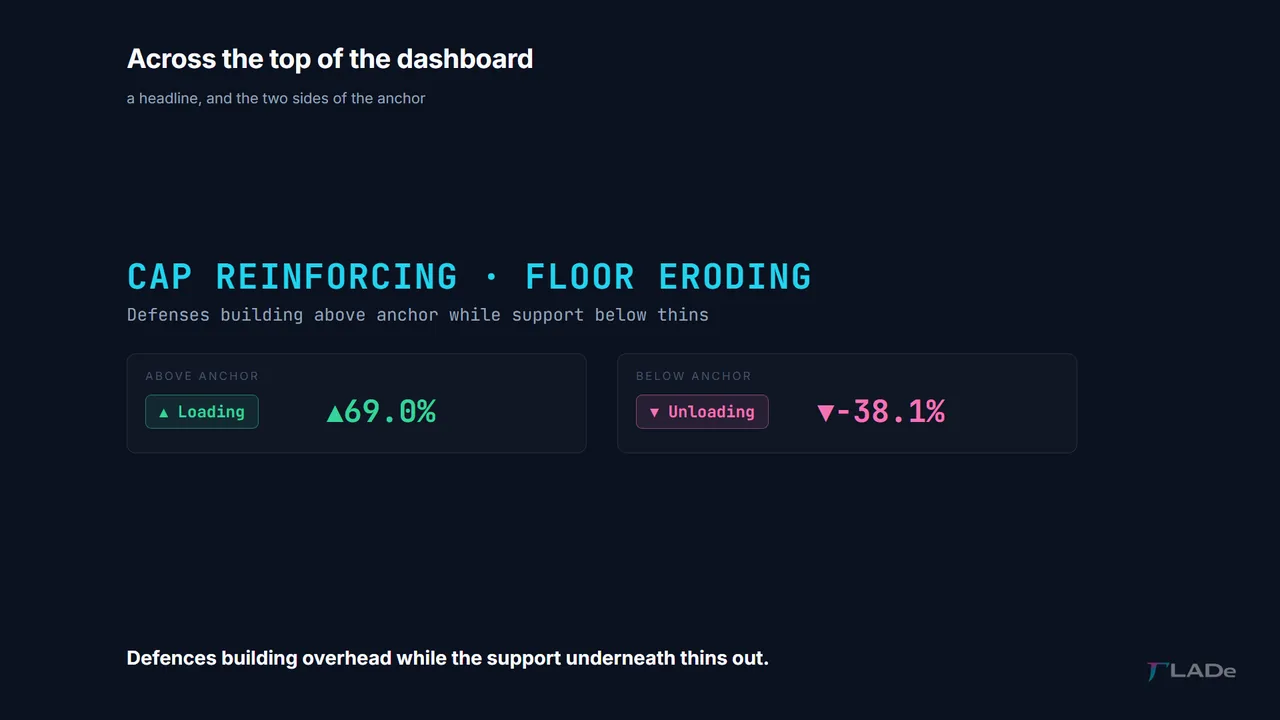
Across the top of the dashboard, a headline. Cap reinforcing, floor eroding. Above the anchor, positions loading, up sixty-nine per cent. Below it, unloading, down thirty-eight. Defences building overhead while the support underneath thins out.
One more thing was known at a quarter past three: employment data at half past eight, New York time.
One strike, three roles: cap, pivot and floor
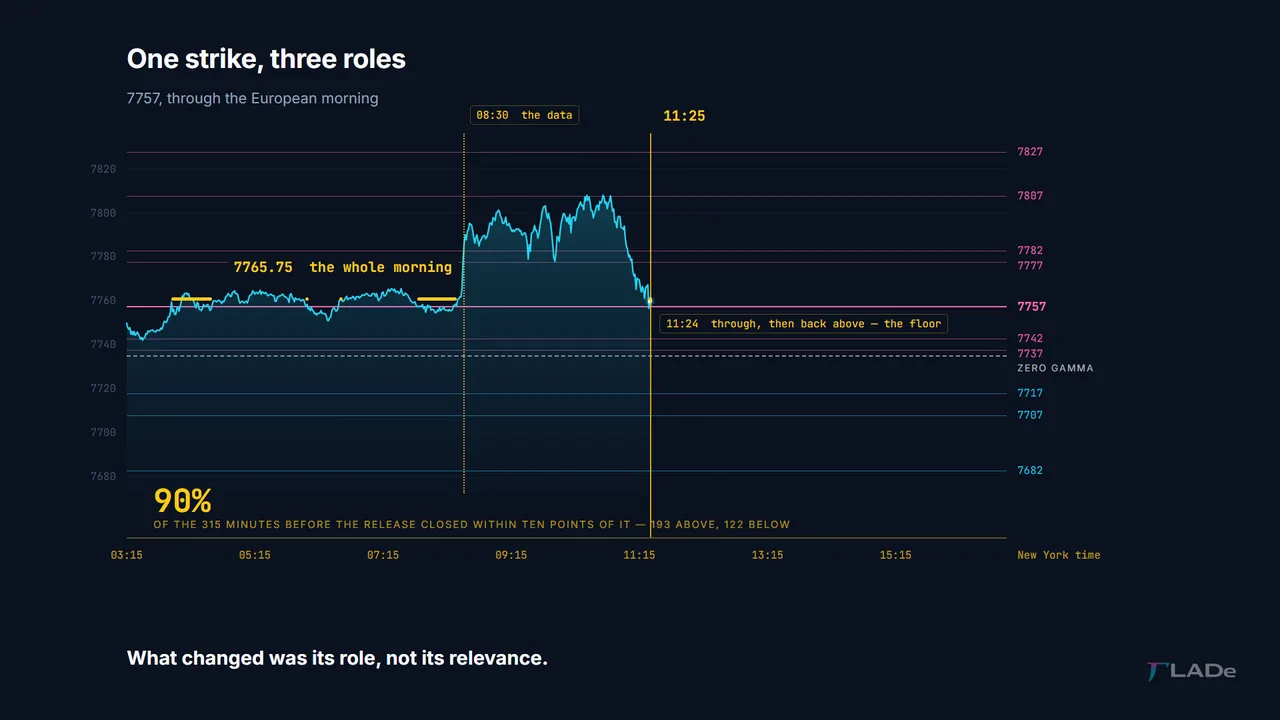
The note published that morning called 7757 the first cap. It capped for forty-two minutes and then stopped capping, and that is not the same as the map being wrong.
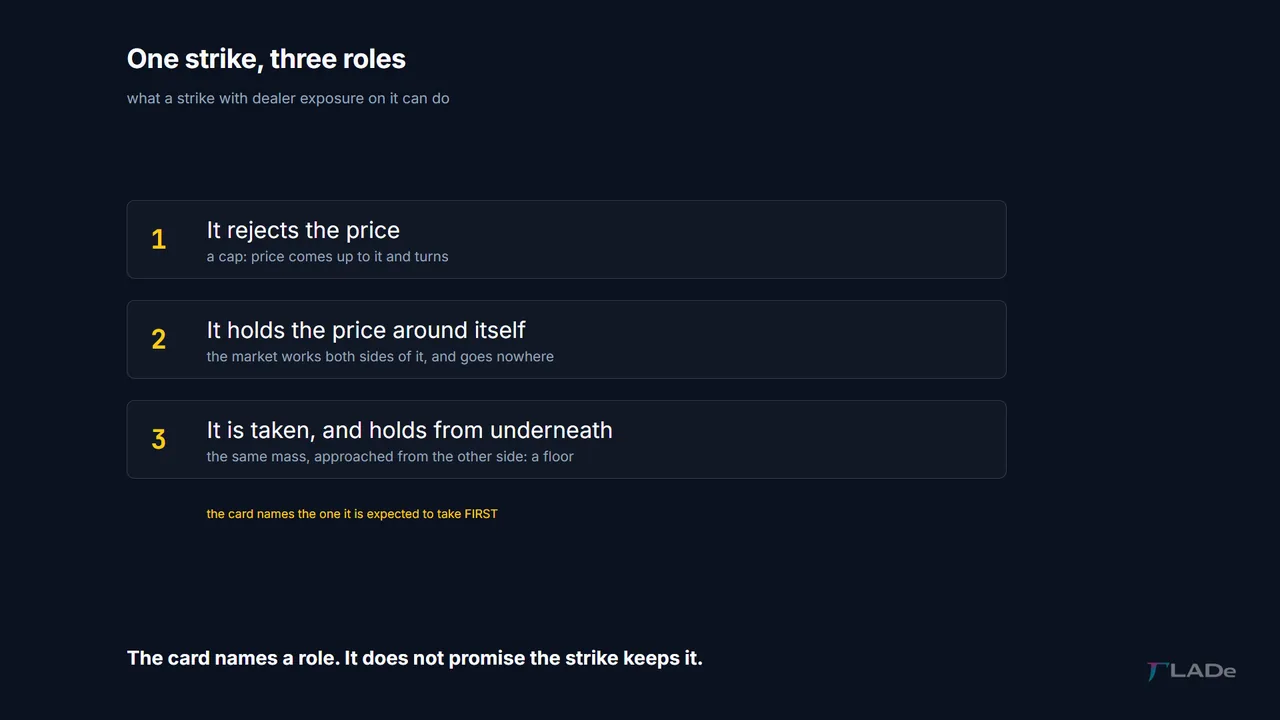
A strike carrying dealer exposure can do three things. It can reject the price. It can hold the price around itself, with the market working both sides of it. Or it can be taken, and then hold from underneath as a floor. The card names the role the strike is expected to take first. It does not promise the strike keeps it.
In the three hundred and fifteen minutes between publication and the data release, 7757 played the first two. The window opened at 7750.50, under the strike, and no minute closed above it until three minutes to four — that is the cap. From there to the release the price worked it from both sides, four separate arrivals, never more than nine points clear of it either way. From a quarter to eight it sat on the strike itself: thirty-two of the next thirty-eight minutes closed just under it.
The third role came after the high, at twenty-four past eleven: two minutes through it, then back above, and it did not return.
The high of those five hours was 7765.75, eight points above the level. A hundred and ninety-three of those minutes closed above it and a hundred and twenty-two closed below, and two hundred and eighty-four of the three hundred and fifteen — ninety per cent — closed within ten points of it.
That is not a level failing to hold. That is the level the whole morning was built on. What changed was its role, not its relevance.
Sixty seconds: the data release
Half past eight, New York. One bar.
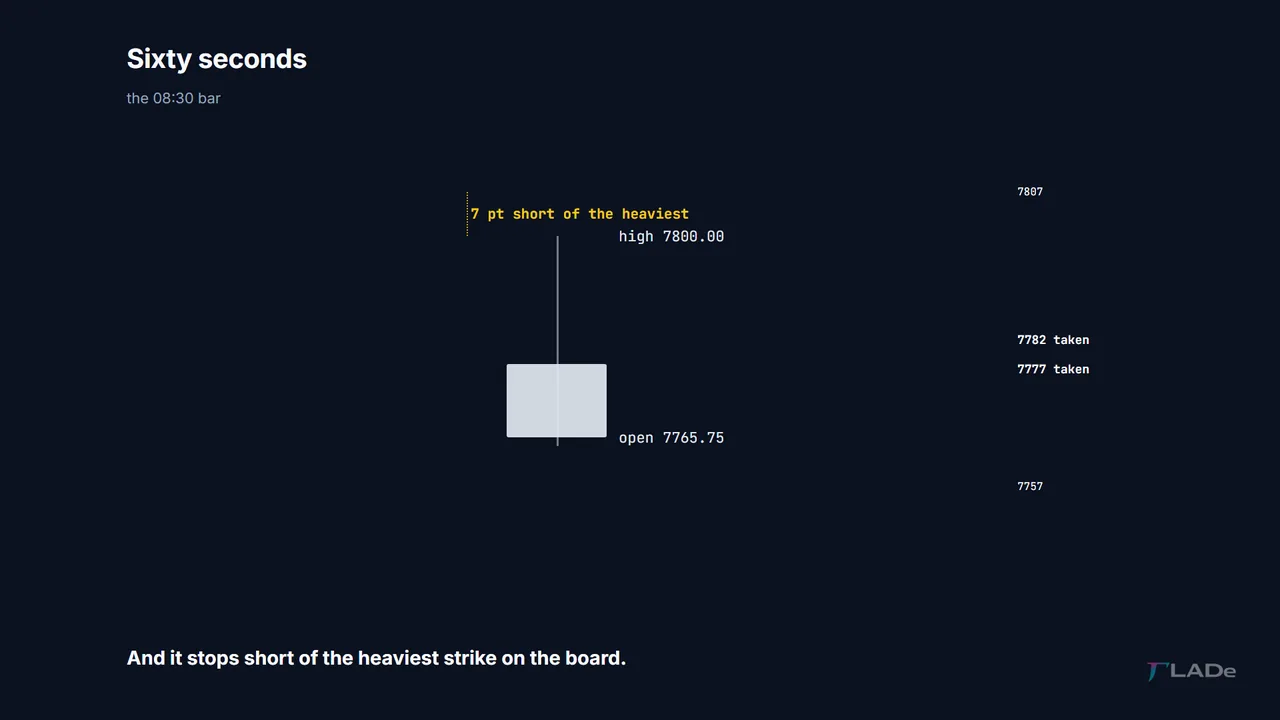
It opens at 7765.75 and prints a high of 7800. Thirty-four points in sixty seconds, on eight thousand contracts in that single minute. On the way it takes 7777 and it takes 7782 — two of the ten — and the Expected Move high with them, all in one candle.
And it stops seven points under 7807.
What a structural map claims after a data release
That is the objection, and it is the right one to raise here, because anyone watching that bar is thinking it. Two levels and the Expected Move high, gone in a minute. What was the map for?
For the minute itself, nothing. In the sixty seconds after a data release the price is not being set by anybody's hedge; it is being set by everybody repricing at once. A structural map does not claim that minute and should not be asked to.
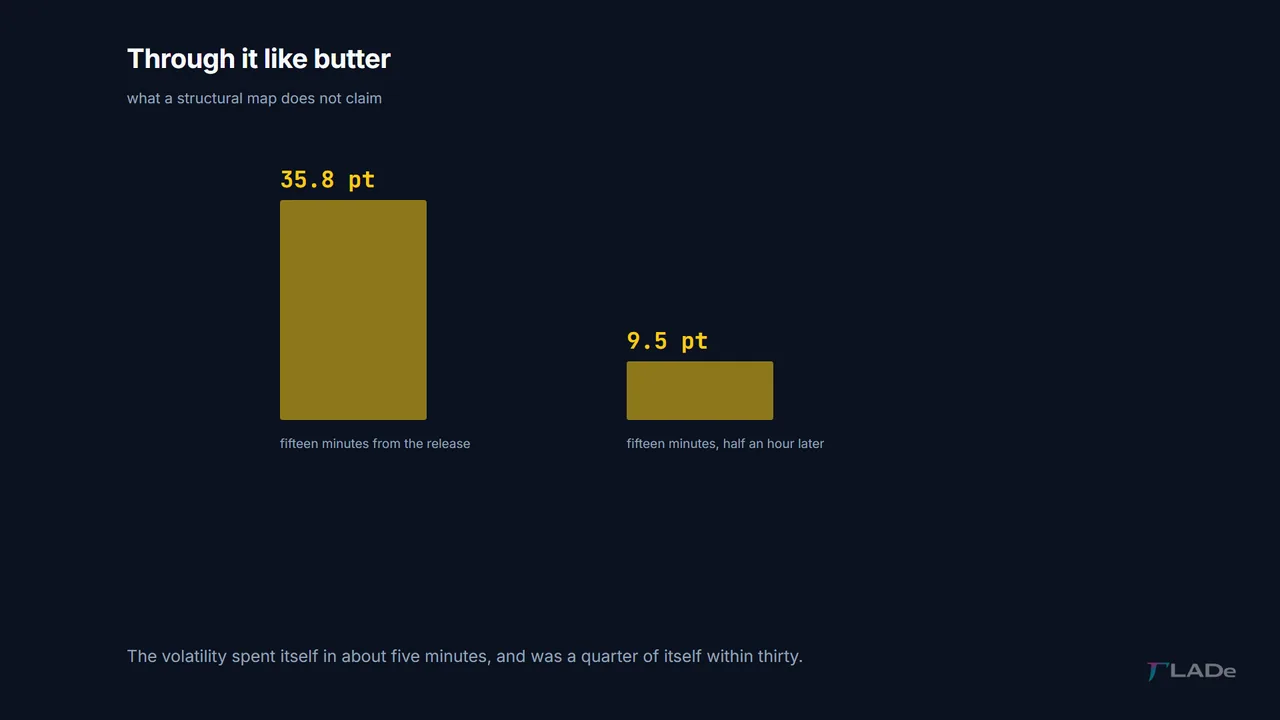
What it claims is the hour after. And the hour after is measurable: in the fifteen minutes from the print, the market covered thirty-six points. In the fifteen minutes starting half an hour later, nine and a half. The volatility spent itself in about five minutes and was a quarter of itself within thirty.
Then the adjustments go back to where the positions are.
Where the day stopped: the heaviest strike
Price worked higher through the morning and arrived at the heaviest strike on the board at twenty-six minutes past ten.
It stayed twenty-four minutes. The high of the whole session came at ten forty-two, and it was 7810.25 — about three points above 7807.
Then it left, and did not come back. From that high the market gave up fifty-six points before the close.
One arrival. One rejection. The level that had the most exposure on it of anything on the screen was the level the day could not get past, and the day's high is within a few points of it.
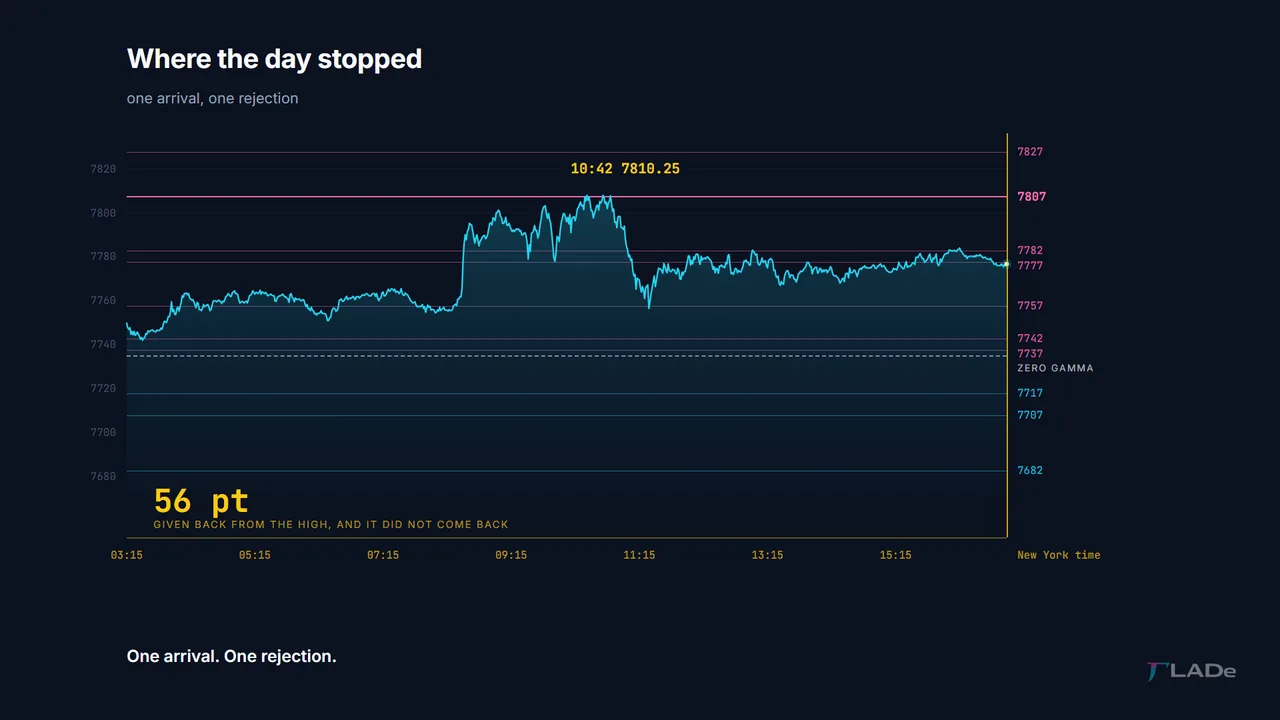
Six of the ten levels were never reached again, from the data to the close.
Where the day was actually spent
The high was the loudest thing the session did. It was not the thing it did most.
Two of the ten levels sat five points apart, just under the heaviest strike. They were 7777 and 7782, a billion and a hundred and thirty million of gamma on one, one point eight billion on the other. The half past eight bar went straight through both of them. Then the price came back, and did not leave.
Of the three hundred and seventy-eight minutes between the high and the close, two hundred and eighty-five — three quarters of them — closed within five points of that pair. The price sat on 7777 for eighty-two minutes from noon, and for another forty-two from a quarter past three. From two in the afternoon to the close, three hours, the whole range of the session was seventeen points, from 7767.25 to 7784.50.
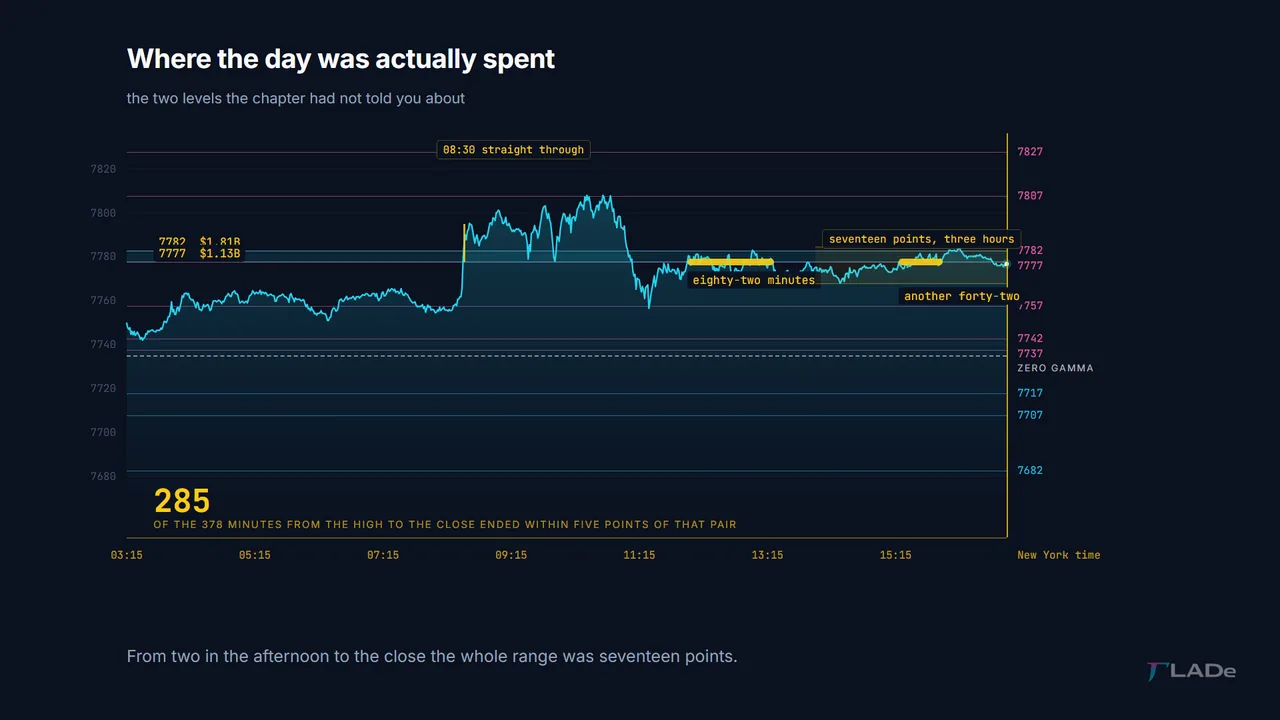
It closed at 7776.50. Less than a point from the strike it had spent the afternoon on.
Eight arrivals on 7777. Seven on 7782. One on the heaviest strike on the board. The map drew all three before the session opened, and the chapter has so far been telling you about the one it visited least.
Reading a level card before the session
Open the heaviest strike's card and read what was on it at a quarter past nine in the morning — before the data, before the move, before any of it.
Weight first, because weight is the parameter that matters most: three point four billion dollars of gamma, the largest on the board. Then the side parameters, the ones you weigh around it. Its speed — how fast the exposure at that strike changes as price moves through it — reads calm. Of the two greek flows, charm is the dominant one, and the card's own reading of it says the net bias weakens the resistance.
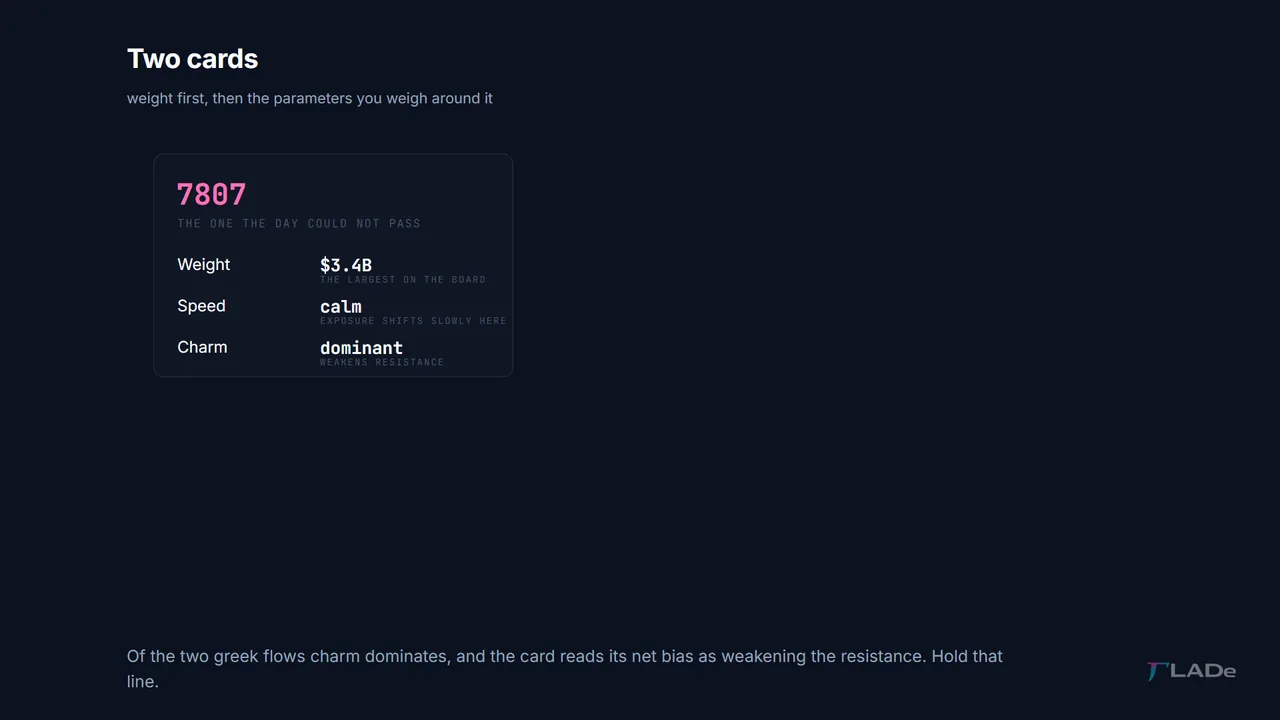
Hold that last line. It is about to be useful, and not in the way you would expect.
Weight, speed and charm: two level cards side by side
Now the other one, 7757, the level price crossed and recrossed and lived on — five separate arrivals, from above and from below, right through to twenty-five past eleven.
Its weight is lower: two point six billion against three point four. So far the ranking matches the day.
Its speed is roughly three times the heavier strike's. And the charm flow is both larger and pointed the other way — on this card the net bias reinforces the resistance.
So read them side by side. Weight picked the strike that made the turn: one arrival, the high of the session, and fifty-six points given back. Speed picked the strike that would be worked over and over, and 7757 was worked five times. The two parameters were not competing. They were answering different questions.
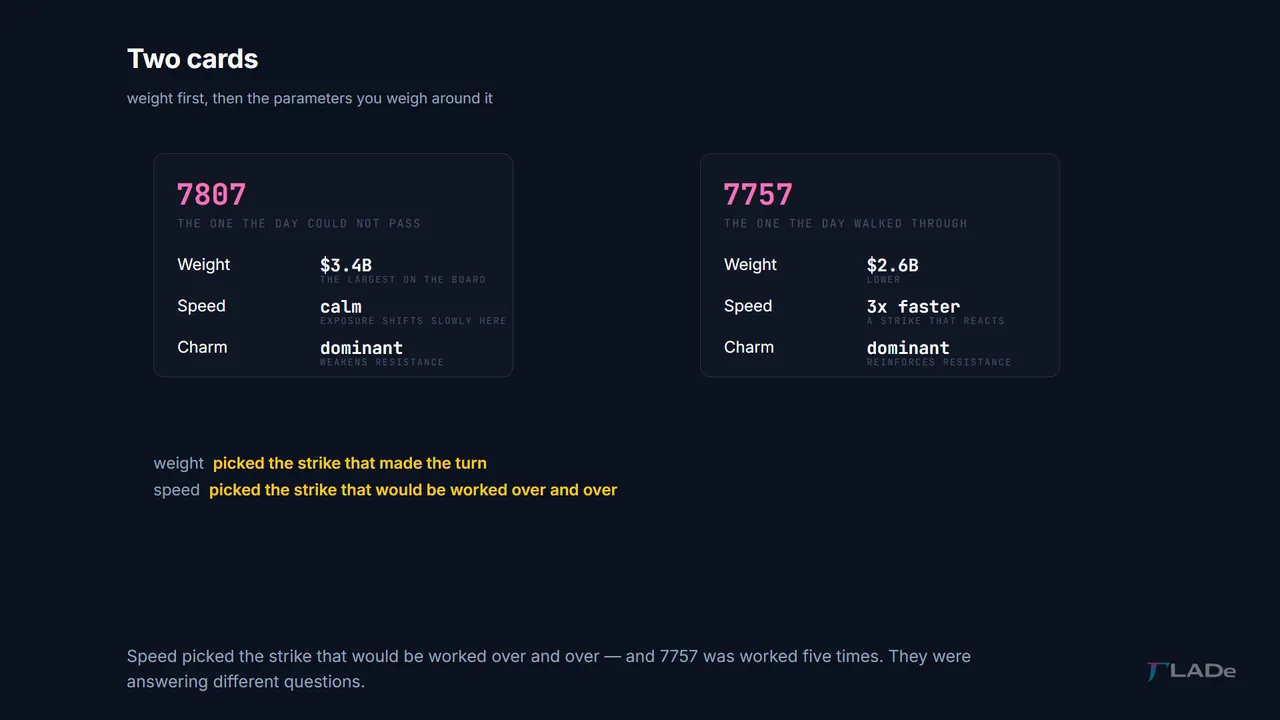
Charm is the one the day does not settle. It read the net bias at 7757 as reinforcing the strike, and the session closed nineteen points above it — but by then the strike had changed sides. The mass carried over into the new role. The direction charm had named did not.
That is what these parameters are for, and it is why there is no single number on the card that settles it. You weigh them. You do not add them up.
Zero Gamma: the border nobody crossed
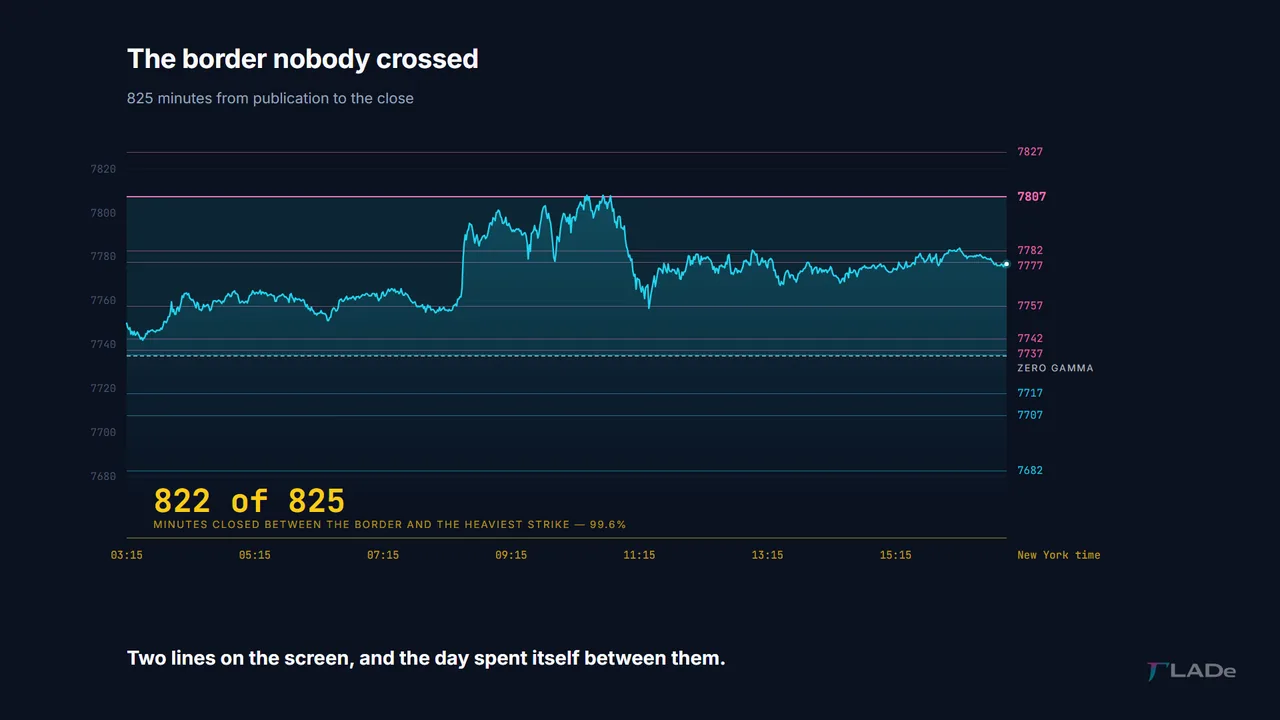
From the moment the map was published to the close, the session ran eight hundred and twenty-five minutes.
Not one of them closed below the Zero Gamma. Not one.
Eight hundred and twenty-two of the eight hundred and twenty-five closed between that border and the heaviest strike above. Two lines on the screen, and the day spent ninety-nine point six per cent of itself between them.
What the day did not settle
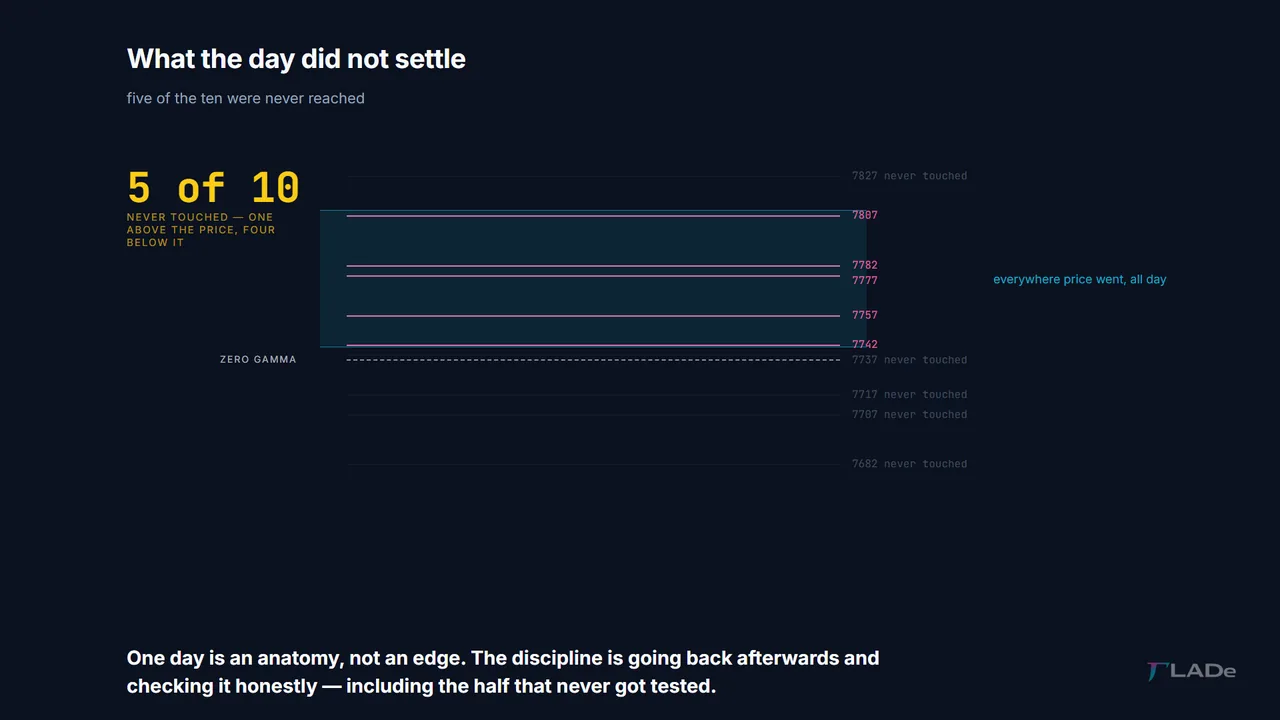
Five of the ten levels were never reached at all. One above the price, and four below it — three of those under the border.
Which means the second half of that morning headline — floor eroding — was never put to the test. Price never went down there to find out. The cap held at 7807 because of what was sitting on that strike, not because the headline said it would. That is not a miss and it is not a hit. It is a question the session declined to ask, about a sentence that was never offered as an answer.
And the five that were never reached are not a failure of the map. That is the sentence from the start of this chapter, now with a day under it: a map of ten levels told you where the session was not going, nearly fourteen hours before the close.
One day. One day is an anatomy, not an edge — it shows you what the parts are and how to look at them, and it proves nothing about the next one. What it can do is teach the sequence: read the structure before the session, mark what the map claims, and then go back afterwards and check it honestly, including the half that never got tested.
That last habit is the whole discipline.
In the next chapter we take on the sequence itself: the order you read these things in, and why the order changes what you see.