Stream TLADe GEX levels — call walls, put walls, zero gamma, expected move, GEX profile — straight into your ATAS workstation. Native indicator on the ATAS side, local receiver on your machine.
The ATAS bridge ships as a native C# indicator + a tiny Python receiver that runs on your machine. The receiver pulls fresh TLADe data each session and the indicator paints walls, zero gamma, EM bands and GEX profile right on the ATAS chart — no manual import.
The ATAS indicator pushes live ticks, closed bars and order-flow deltas to the local Python receiver (localhost:5000). The receiver caches the latest TLADe session and feeds it back to the ATAS dashboard so call walls, put walls, zero gamma and the GEX profile stay in sync with every published Mother snapshot — Asia, Europe, Pre-Open, RTH Open, Opening Range, Close.
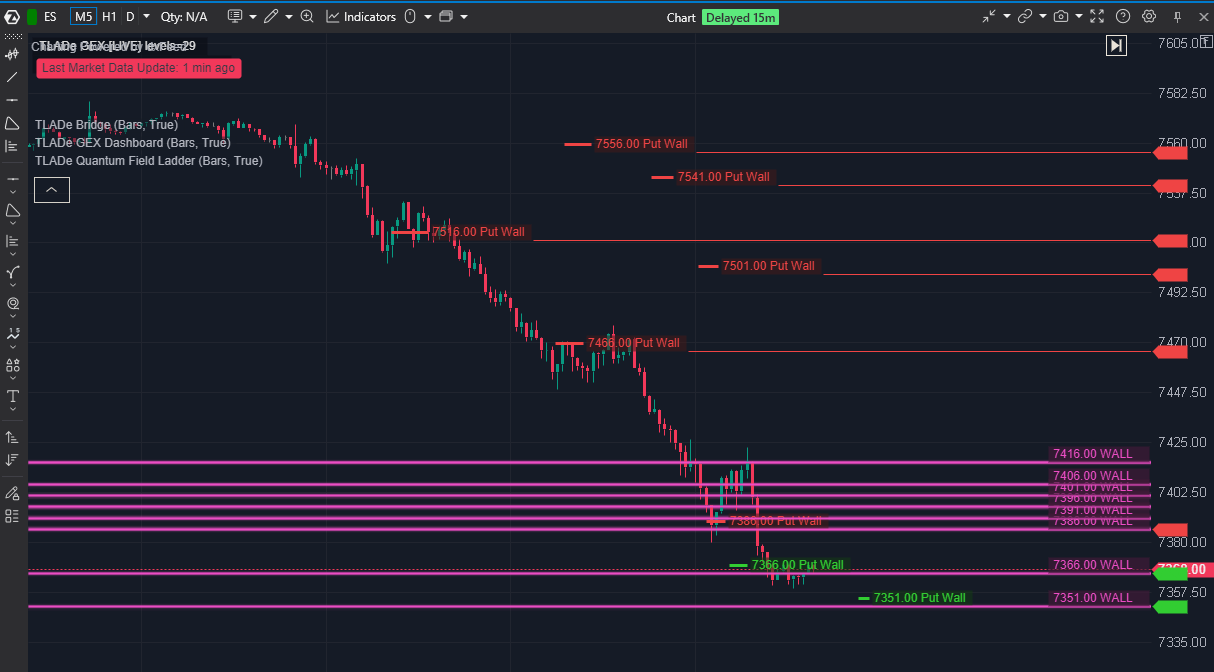
Call walls, put walls, zero gamma, expected move bands and the full GEX profile drawn on your ATAS chart. Same data layer as the TLADe Terminal — only the renderer changes.
The TLADe Field topology rendered as a vertical ladder of mass + charge per strike. Magnets, fast lanes and Lagrange boundaries — the force field behind the bars.
The C# indicator + a small Python receiver run on your machine. Pushes live ES/NQ ticks and closed bars at ~10ms latency. Auto re-backfills on Python restart, JSON-safe formatting, OHLC validity guards.
Native C# build on each side. The macOS port handles ATAS X's timezone quirks (auto-detected time strategy) so the chart aligns whatever the OS region. Fixes are upstreamed on both platforms.
Any active plan (Daily $1.99, Monthly $9.99, Yearly $99*) unlocks the live data feed the receiver pulls each session.
*Prices exclude EU VAT where applicable
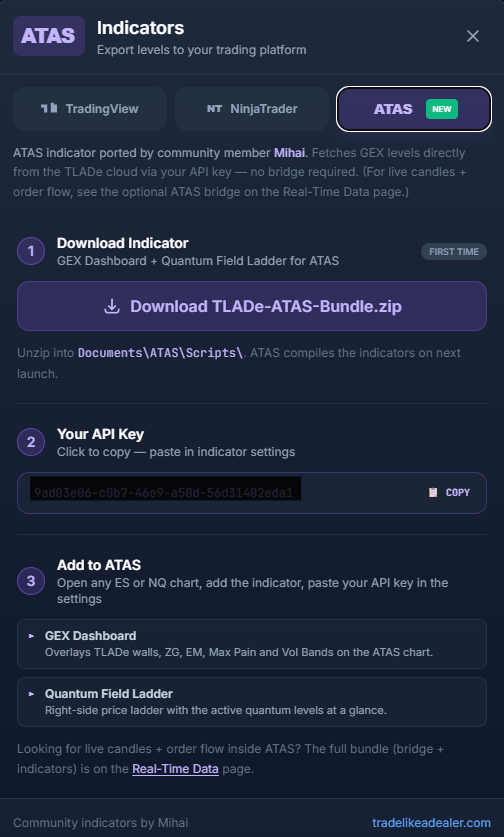
Grab TLADe-ATAS-Bundle.zip and unzip it. It already includes the ready-to-use indicator — TLAdeBridgeATAS.dll. No .NET SDK, no compiling, no "Scripts" folder.
Close ATAS completely, then copy TLAdeBridgeATAS.dll into %APPDATA%\ATAS\Indicators (create the folder if it isn't there). Re-open ATAS, open a chart, and add TLADe GEX Dashboard from the Indicators list — the walls and levels appear. macOS uses the community mac/ port; advanced users can build the .csproj in the zip instead of using the DLL.
Only if you want your ATAS price streamed into the TLADe web terminal: double-click start.bat — it launches the Python receiver on localhost:5000 and the ATAS indicator auto-detects it. You do not need this just to see the walls on your ATAS chart.
Open the ATAS card inside the TLADe terminal and the setup modal walks you through it end-to-end: download the bundle, drop the ready-made DLL into ATAS, and — only if you want to feed the web terminal — launch the local receiver. Mac users get the platform-specific notes inline.
Same TLADe data layer, native to your order-flow workstation. Free bridge, MIT-licensed, community-maintained on Windows and macOS.
Start with TLADe View on GitHub