Call/put walls, zero gamma, max pain, expected move and the GEX profile directly on your Quantower chart. In Live mode the indicator fetches the levels from the TLADe cloud with your API key.
With Live mode on, the indicator fetches the TLADe data string itself from the cloud endpoint and refetches it at the six TLADe session times. ES maps to SPX and NQ to NDX automatically.
Written from scratch for Quantower by Dogan Cile and published as delivered, while it is tested with the community. It draws the feed levels and the profile; the levels computed from chart bars (structure, breakouts, session AVWAPs, session boxes, confluence zones, wall-flip marking, alerts) are not in it yet.
The gamma walls as horizontal levels, the strongest or the nearest to price, with an optional price radius.
Zero Gamma, Max Pain, the Expected Move (Globex and RTH), the Vol Bands and the Charm Magnet from the TLADe cloud.
The gamma exposure per strike as a histogram at the edge of the chart, with its own alignment, scale and colours.
A status dot and a refresh button on the chart, and three refresh modes: the six sessions, a fixed interval, or manual only.
A real screenshot from Quantower, not a mock-up. Click it to open full size.
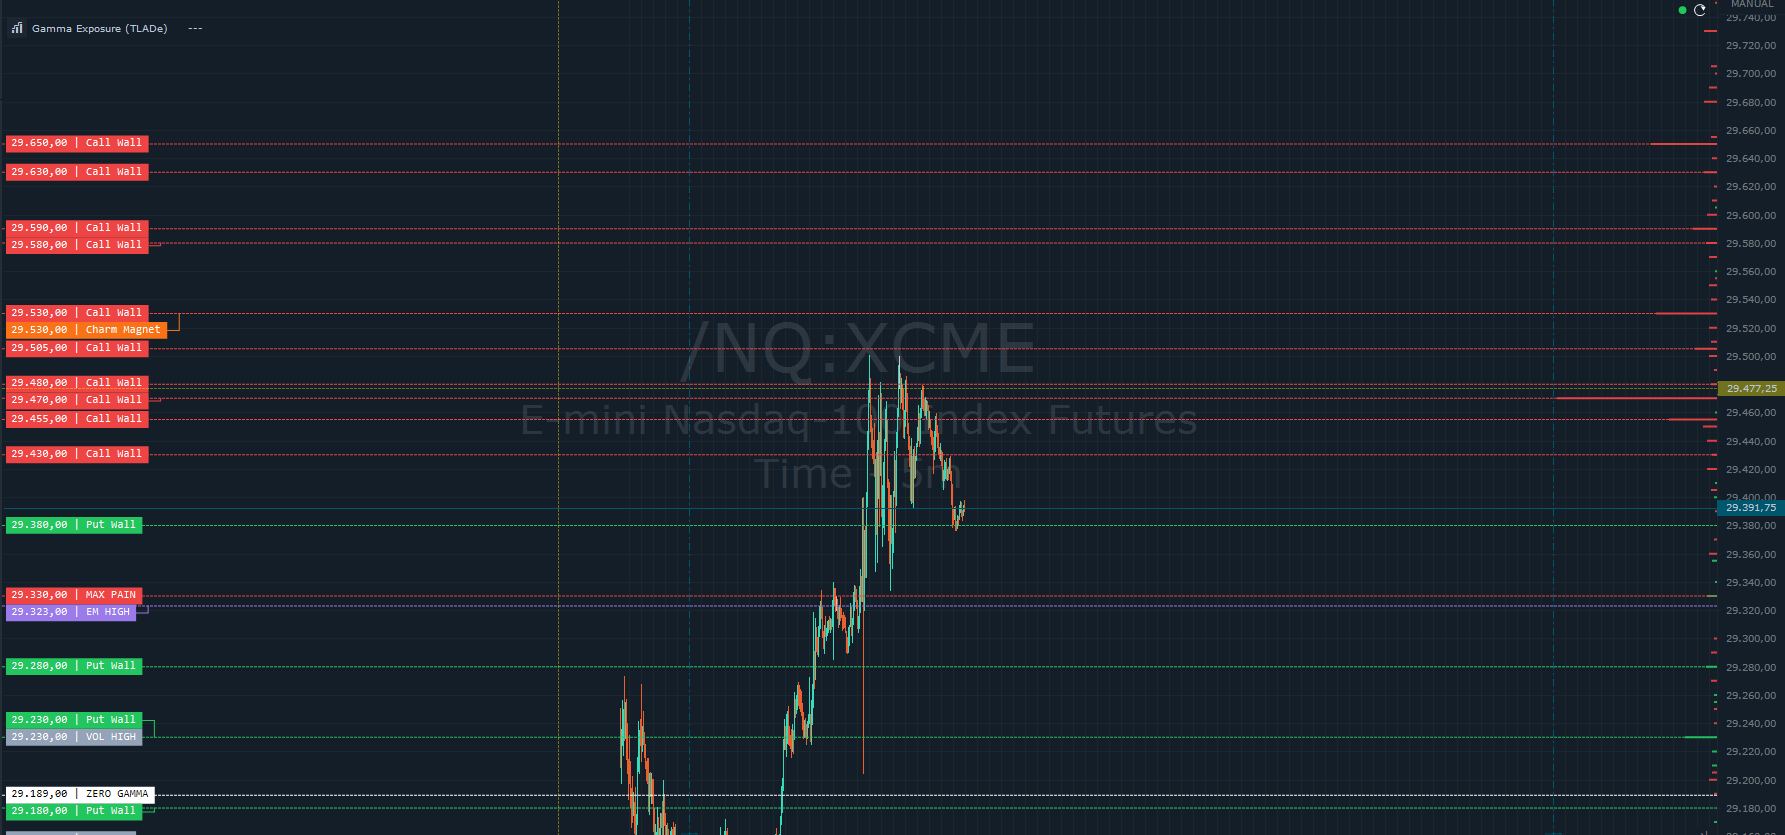
NQ on Quantower: the Call Walls stacked above price, the Put Walls below, Charm Magnet, Max Pain, EM High, Vol High and Zero Gamma, each labelled on the left.
Get the .zip from the TLADe Terminal (Indicators page → Quantower). Close Quantower and copy GammaExposure.dll into <Quantower folder>\Settings\Scripts\Indicators\GammaExposure\ (create the folder; the default Quantower folder is C:\Quantower).
Any active plan (Daily $1.99, Monthly $9.99, Yearly $99*) unlocks the API for the live feed. Without a key the indicator uses the free, delayed endpoint.
*Prices exclude EU VAT where applicable
Start Quantower, open an ES or NQ chart and add Gamma Exposure from the indicators list. Set Live = on and paste your key into TLADe API key.
See the same GEX levels professional dealers use — directly on your Quantower chart.
Start with TLADe