Now on Sierra Chart · Beta

ES & NQ Gamma Exposure Indicator
for Sierra Chart

GEX levels, call/put walls, zero gamma and expected move bands directly on your Sierra Chart chart, with the session AVWAPs, worldlines, breakouts and session boxes computed from your own bars. Data auto-updates with your TLADe subscription — no manual paste needed.

Download Indicator

The same indicator.
Now on Sierra Chart.

The Sierra Chart study is a port of the TLADe indicator for ATAS, NinjaTrader and MotiveWave: same levels, same names, same colours, same rules. It fetches the GEX levels directly from the TLADe API with your own key, and refreshes as soon as a new session is published.

Beta

The study is new and still in beta: the levels it receives are the levels the terminal shows, and every calculation follows the terminal's rules, but it has not been on many Sierra Chart setups yet. If something looks wrong on your chart, send us a screenshot.

What you see on chart

🧱

Call & Put Walls

The strongest gamma strikes as horizontal levels, with the nearest wall above and below price always on screen. A wall that price has closed beyond is marked as flipped.

⚡

Zero Gamma & Expected Move

The pivot where dealer gamma flips sign, Max Pain, the Expected Move and the Vol Bands, Delta Flip and Charm Magnet, all from the TLADe cloud.

📈

Session AVWAPs & Worldlines

Asia, Europe, US and the previous day's US AVWAP, re-anchored at the 18:00 ET rollover, plus the H1 worldlines — computed from your chart's own bars.

📐

Structure & Sessions

Breakout levels on H1, H4 and daily closes, previous day and week high/low, session boxes, confluence zones and the GEX profile at the right edge.

What a normal day looks like

A real screenshot from Sierra Chart, not a mock-up. Click it to open full size.
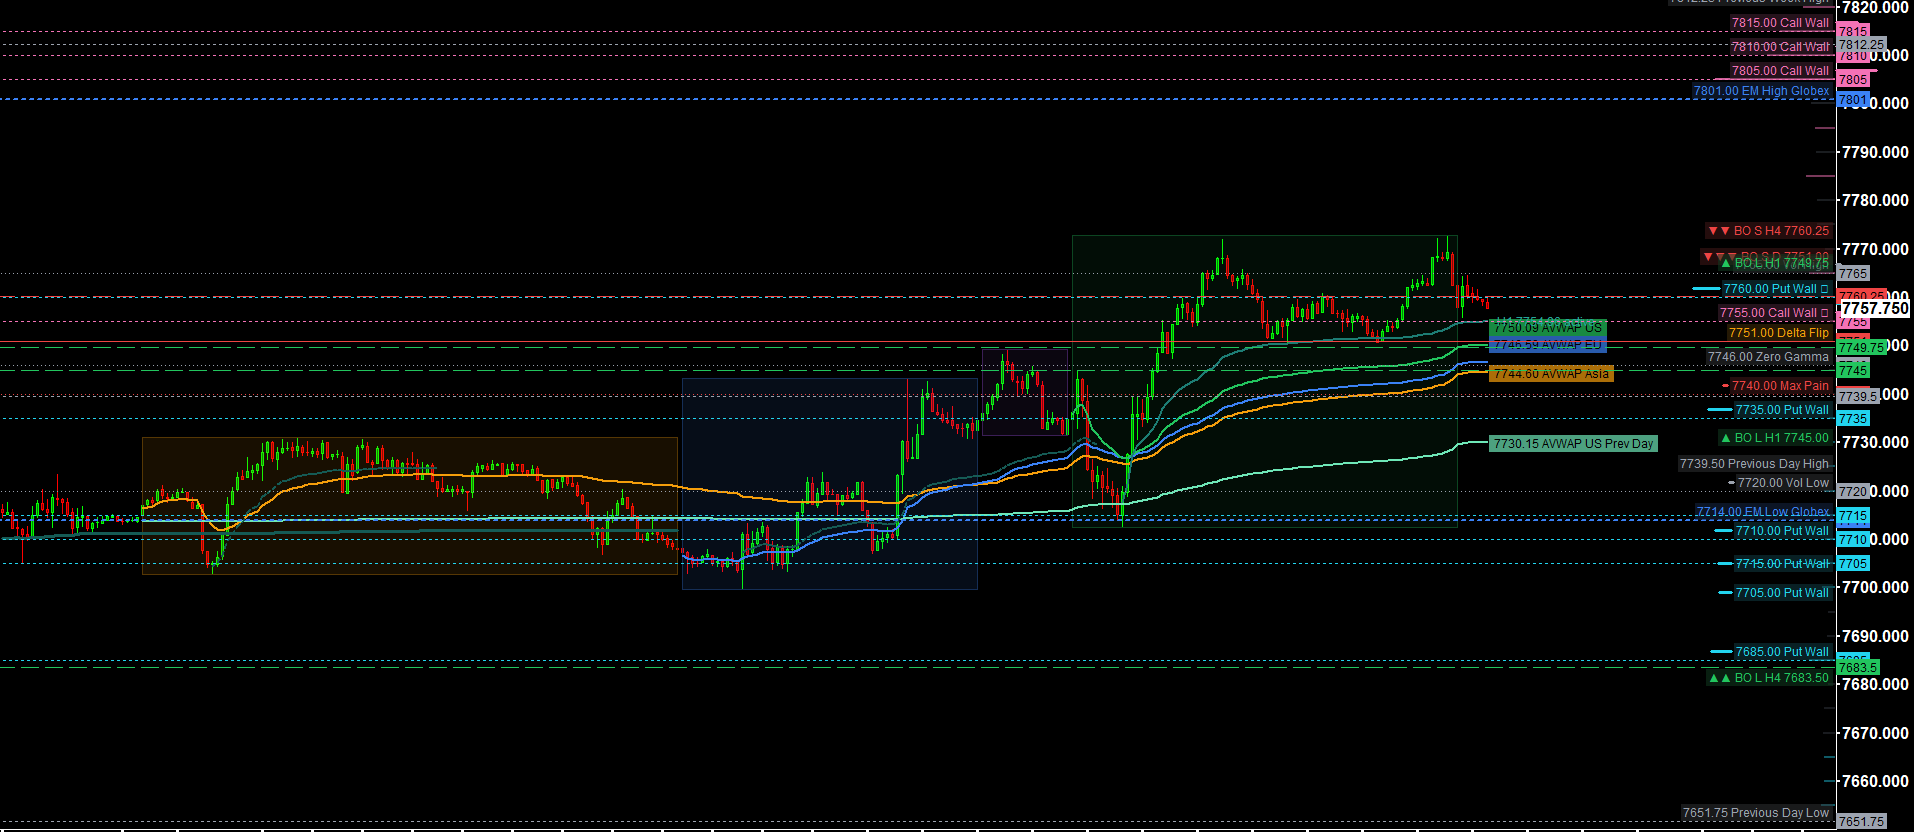
TLADe GEX Dashboard on a 5-minute ES chart in Sierra Chart: Call Walls above price, Put Walls below, Zero Gamma, Max Pain, Expected Move and Vol bands, Delta Flip, session AVWAPs, session boxes and breakout levels.

ES on 5 minutes. The four session AVWAPs climb together through the US session, price holds above Zero Gamma at 7746 and the Delta Flip at 7751, and stalls between the 7755 Call Wall and the 7760 Put Wall. Every line on the chart is drawn by the study.

Get started in 3 steps

1

Download the study

Get the .zip from the TLADe Terminal (Indicators page → Sierra Chart). Close Sierra Chart and copy the .dll into your Sierra Chart Data folder — or copy the .cpp into ACS_Source and build it yourself with Analysis → Build Custom Studies DLL → Remote Build.

2

Subscribe to TLADe

Any active plan (Daily $1.99, Monthly $9.99, Yearly $99*) unlocks the API. The study uses your own API key to fetch live GEX data automatically.

*Prices exclude EU VAT where applicable

3

Add to chart

Analysis → Studies → Add Custom Study → "TLADe GEX Dashboard", on an intraday ES or NQ chart (1 to 60 minutes). Paste your API key in the first input. The status in the top-left corner says which publication the levels come from.

Two Sierra Chart studies TLADe GEX Dashboard is built and maintained by TLADe: a port of our ATAS, NinjaTrader and MotiveWave indicator. It reuses the network code, the API key handling and the status corner of the first Sierra Chart study for TLADe, written by Alex — with thanks.

TLADe Quantum Field Ladder is Alex's own study, the first TLADe integration for Sierra Chart: a community contribution, published with his permission and the corrections we applied to it (the index-to-ETF ratio and the magnets read from the data). It is his work and keeps his credit; new releases come from him.

Source and every published version: github.com/tradelikeadealer/tlade-bridges · all releases

Ready to trade with structure?

See the same GEX levels professional dealers use — directly on your Sierra Chart chart, auto-updated across every session.

Start with TLADe