The common misconception about gamma exposure
There is a common misconception about what gamma exposure does to a price. It is worth taking on before anything else.
Here is where it comes from. Somebody large sold those calls, and the desks on the other side are long them — they did not want them, they wanted the spread between bid and ask, so they cancel the exposure in the futures, where one contract moves one for one with the index. And a desk that is long calls sells futures as the index rises. So the hedging leans against the move, and one conclusion follows from that: when price reaches the strike, the selling arrives. The level is where it happens.
Nothing while price climbs. Then, at the level, a wall of futures hitting the bid, and the move back down.
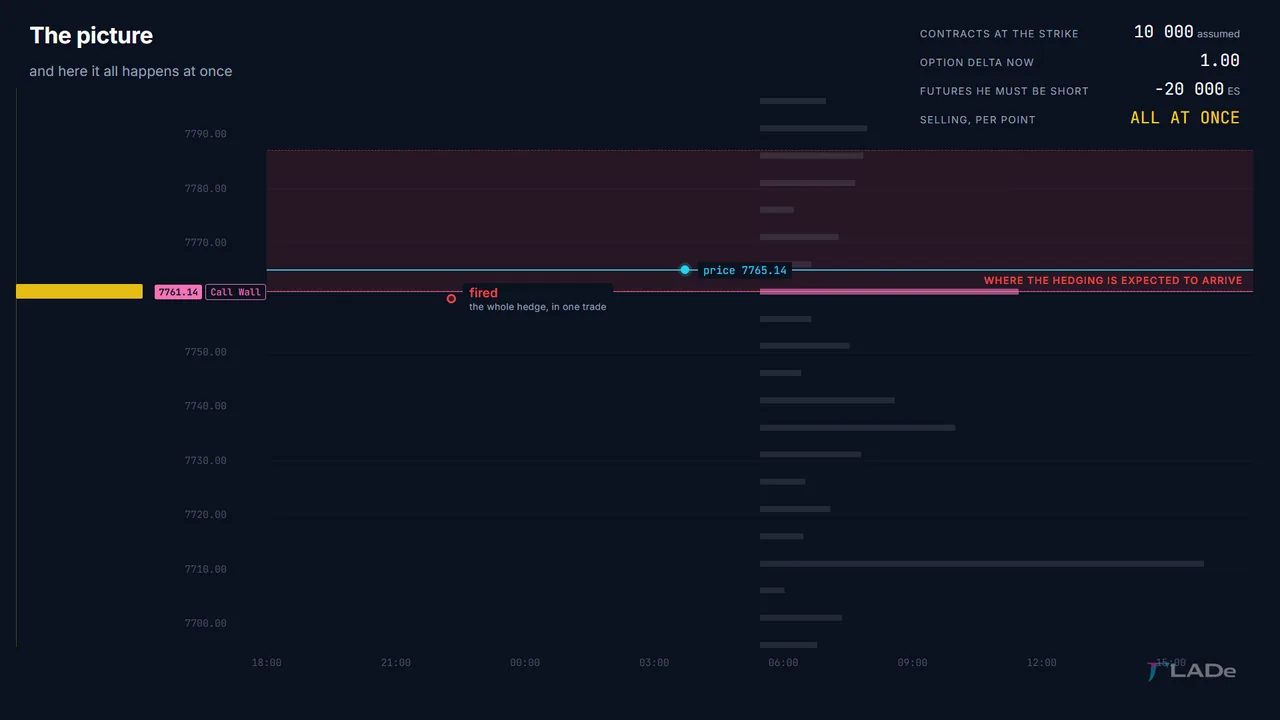
Almost everything in that is right. The desk really is selling. That is how we read the board too, and later in this chapter I will show you exactly how much of it is an assumption.
What is wrong is when.
Nothing switches on there, because nothing was ever switched off.
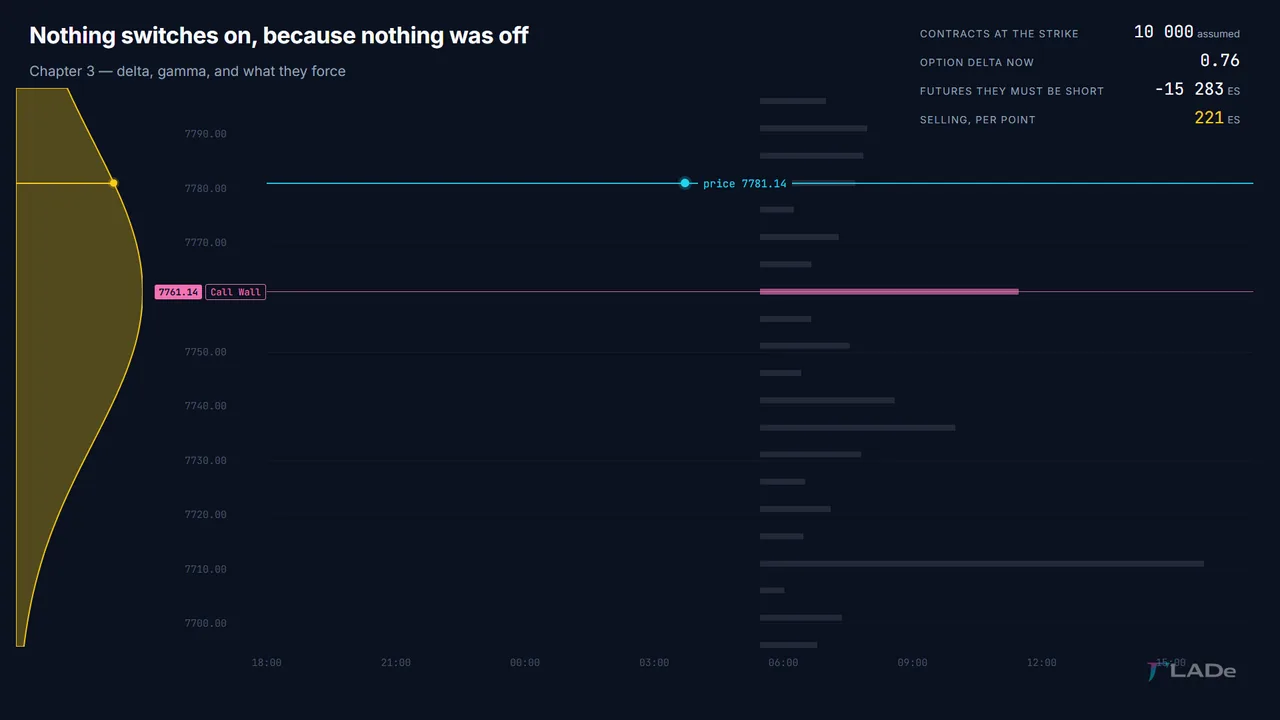
That is what this chapter is about: what is actually happening, point by point, and where the standard reading of positive and negative gamma comes from once you have seen it.
Delta and gamma: the hedge is arithmetic, not a decision
How many futures do they need? Exactly as much as the option moves when the index moves.
An option far away from its strike barely reacts: the index moves ten points and the contract shrugs. An option at its strike reacts to about half of every point. An option deep past its strike moves point for point — at that stage it is the index, for all practical purposes.
That fraction — how much the option moves per point of index — has a name. Delta. And the hedge is just delta: hold that fraction, in futures, with the sign flipped. No judgment enters anywhere.
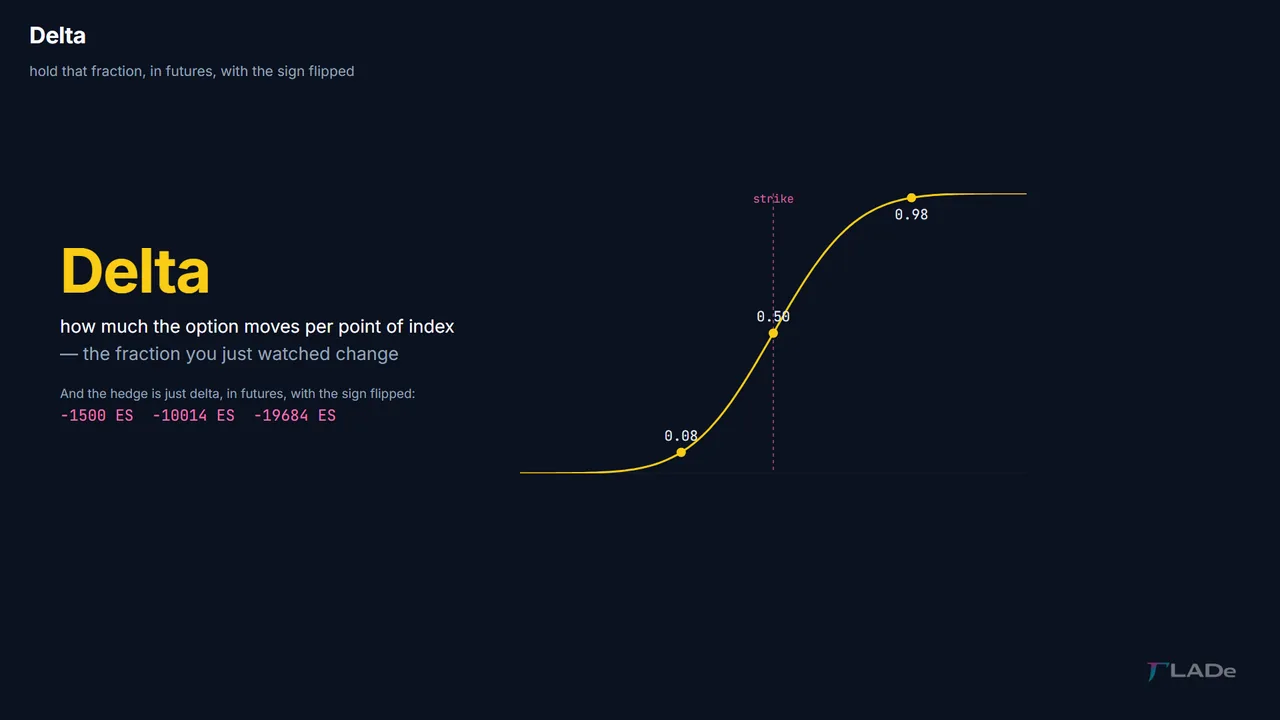
Delta is not a setting that clicks over at the strike. It changes continuously, every point of the way, which means every point of index movement forces a trade. How much trading each point forces — the rate at which delta changes — also has a name. Gamma. Delta is how much they hold; gamma is how much that holding changes per point.
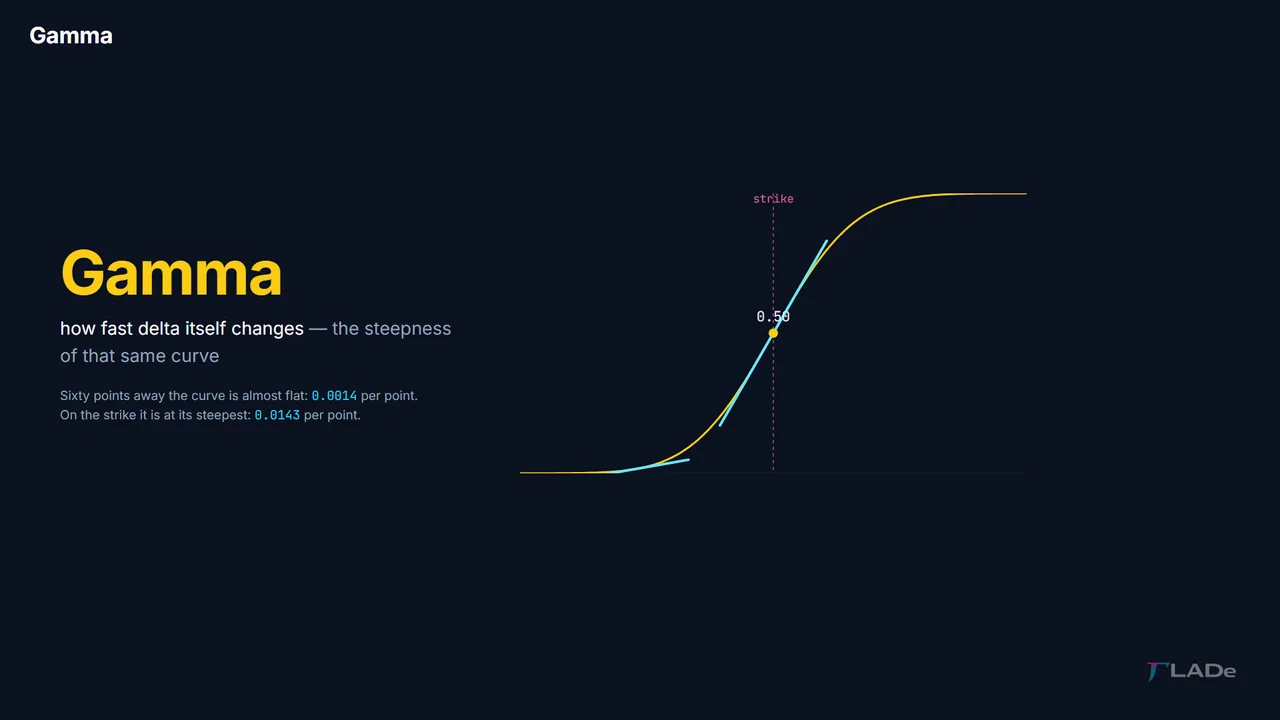
Those two words are the whole vocabulary of this chapter. What they do to a price is the rest of it, and I am going to show you rather than tell you.
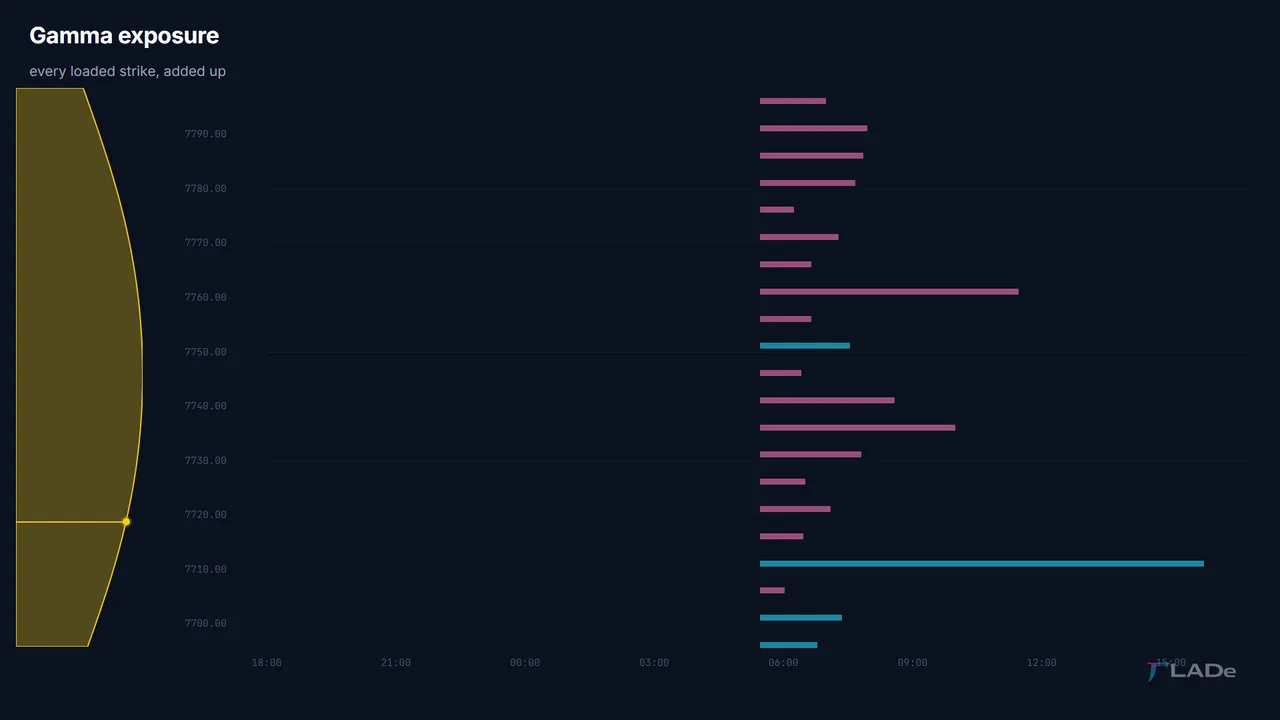
Gamma exposure: adding up the board
One strike forces trading at every price. The board is all of them at once.
At any given price, every loaded strike is contributing something: the near ones a lot, the far ones almost nothing, the ones with more contracts open more than the ones with fewer. Add them up and you have a single number for the whole board — how much forced trading arrives, in total, per point of index movement, at this price.
That total is gamma exposure. It is not a forecast and it is not a level. It is a quantity, and it changes as price moves, because which strikes are near changes as price moves.
The sign of gamma, Zero Gamma and the one assumption behind them
So far, nothing here required an assumption. How much trading a point forces is arithmetic: the chain says how many contracts are open at each strike, and the sensitivity of an option is a calculation.
Which direction that trading goes is a different matter, and it needs something the data does not contain.
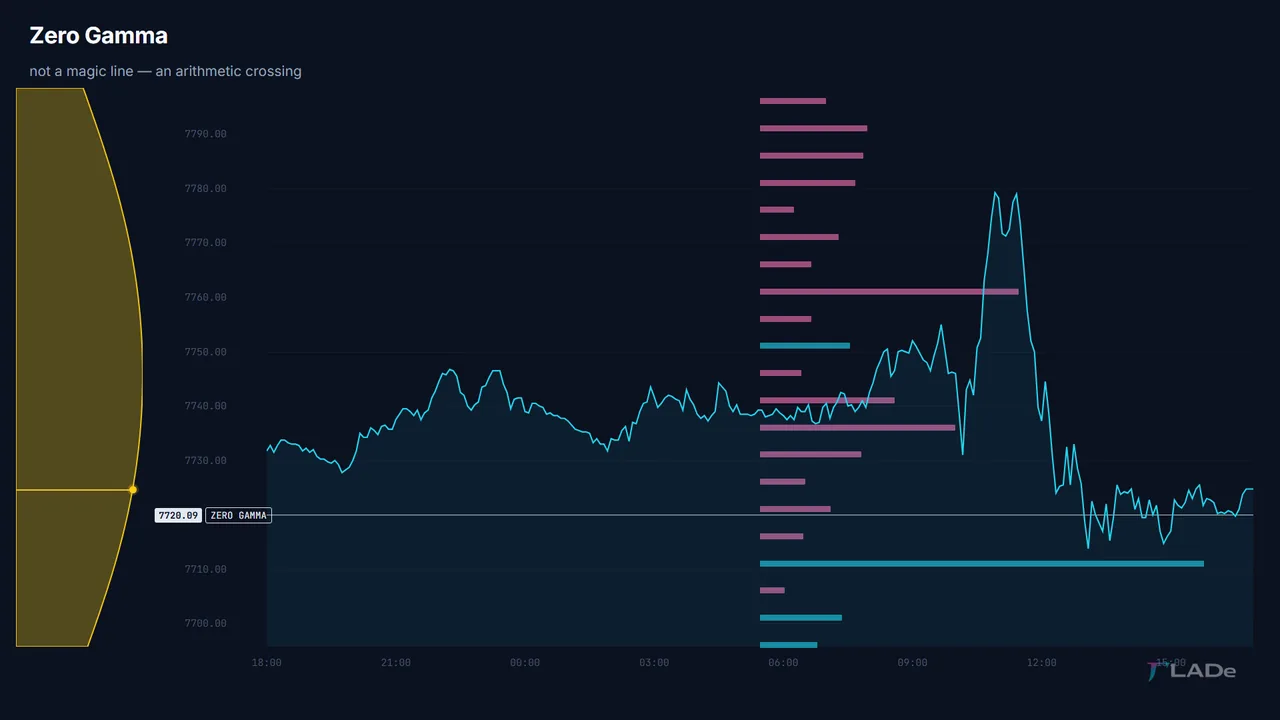
If the desks are holding more options than they have sold, their hedging runs against the move: price rises, their position lengthens, they sell into it; price falls, they buy. Every move is met by somebody who has to lean the other way. If they have sold more than they hold, the sign flips and the hedging runs with the move: rises are met with buying, falls with selling.
That is where the standard reading comes from. Positive gamma is the first case and it is called damping; negative gamma is the second and it is called amplification. The labels are not a theory about markets — they are the two possible signs of the same arithmetic.
And the price at which the sum crosses from one sign to the other has a name, Zero Gamma. It is not a magic line. It is an arithmetic crossing.
Here is the honest part. Open interest carries no signature. It tells you that contracts exist at a strike, never who bought and who sold.
Everybody reading this data resolves that with a convention, and so do we: calls are counted as if the desk were long them, puts as if the desk were short them. That is the convention almost every model of this kind uses, and it is why the sum can come out either way and can cross zero at all. It is not a description of who actually traded — you have already seen, twice, how many different reasons put a contract on the board, and each of them puts the desk on a different side. The convention is applied the same way at every strike, so it is consistent. It is not knowledge.
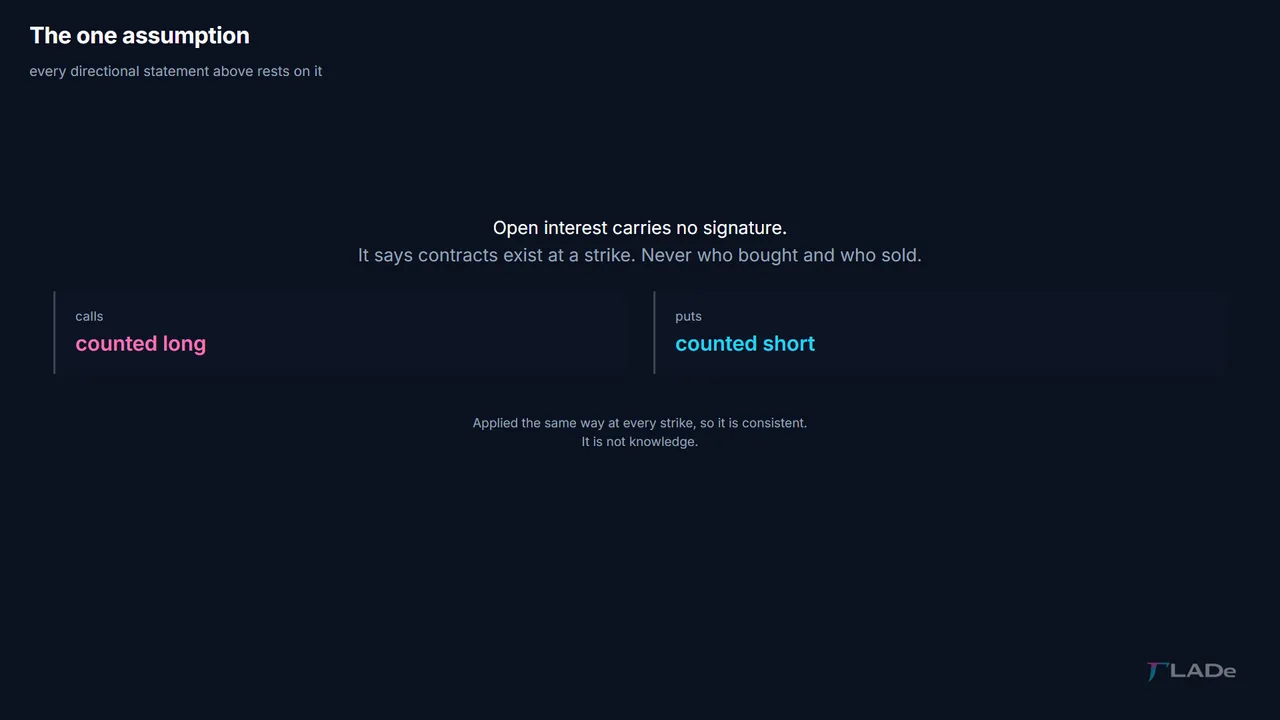
It is the only assumption in the chapter, and every directional statement above rests on it.
Four moments at one strike
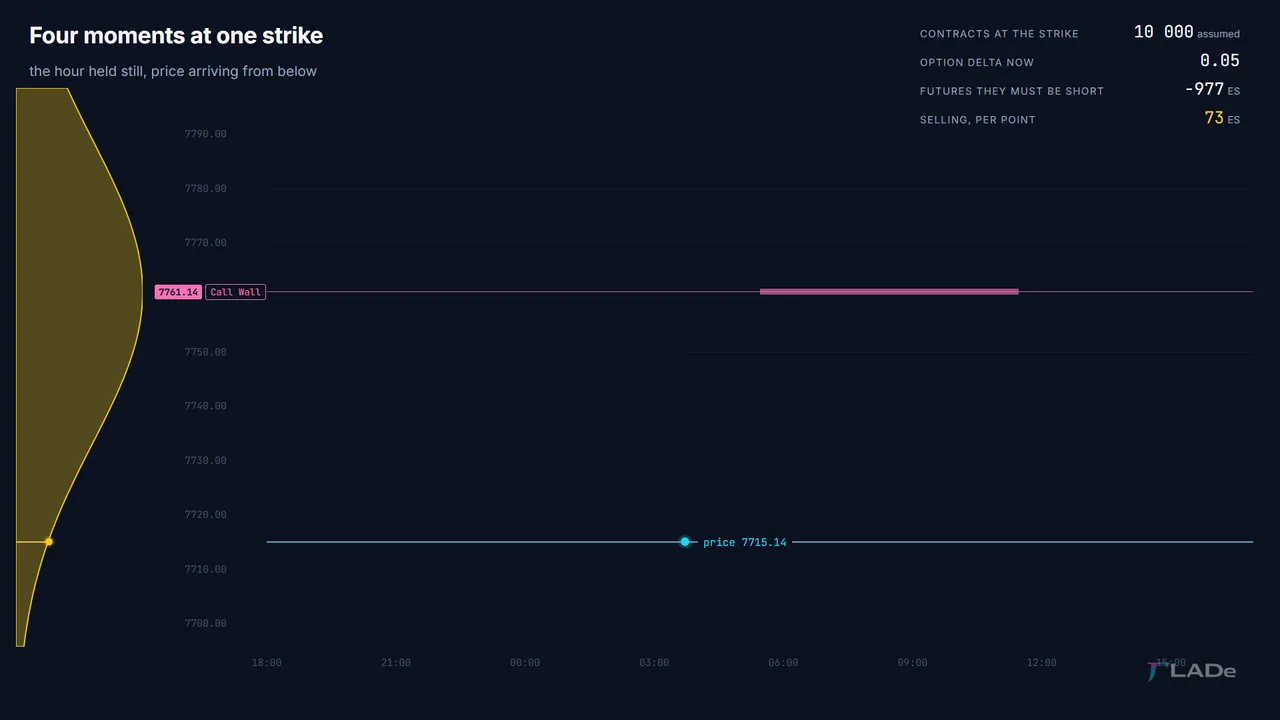
So much for what the words mean. Now take one strike, put it under a microscope, and walk through it in order: coming up to it, standing on it, past it, and coming back through. Four moments. Then run the same four with the sign flipped, because the sign is the only thing that changes.
The hour is held still throughout, and price arrives from below.
Positive gamma: what happens as price reaches a big strike
Coming up to it: Every point up forces selling, and each point forces more of it than the point before. Nothing is waiting anywhere: the flow is arriving the whole time, and it is growing. For price to make the next point, the buyers have to absorb more forced selling than they absorbed for the last one. The climb is not blocked. It is getting progressively more expensive.
At the strike: The rate is at its maximum here — this is the most expensive single point on the chart to cross. And at that same moment, an option sitting on its strike has a delta of about one half. Which means the desk is already carrying half of the entire futures position that this strike will ever ask of it. Half. Not none. That is the sentence the picture is missing: the flow people wait for at the level is fifty per cent spent before price gets there.
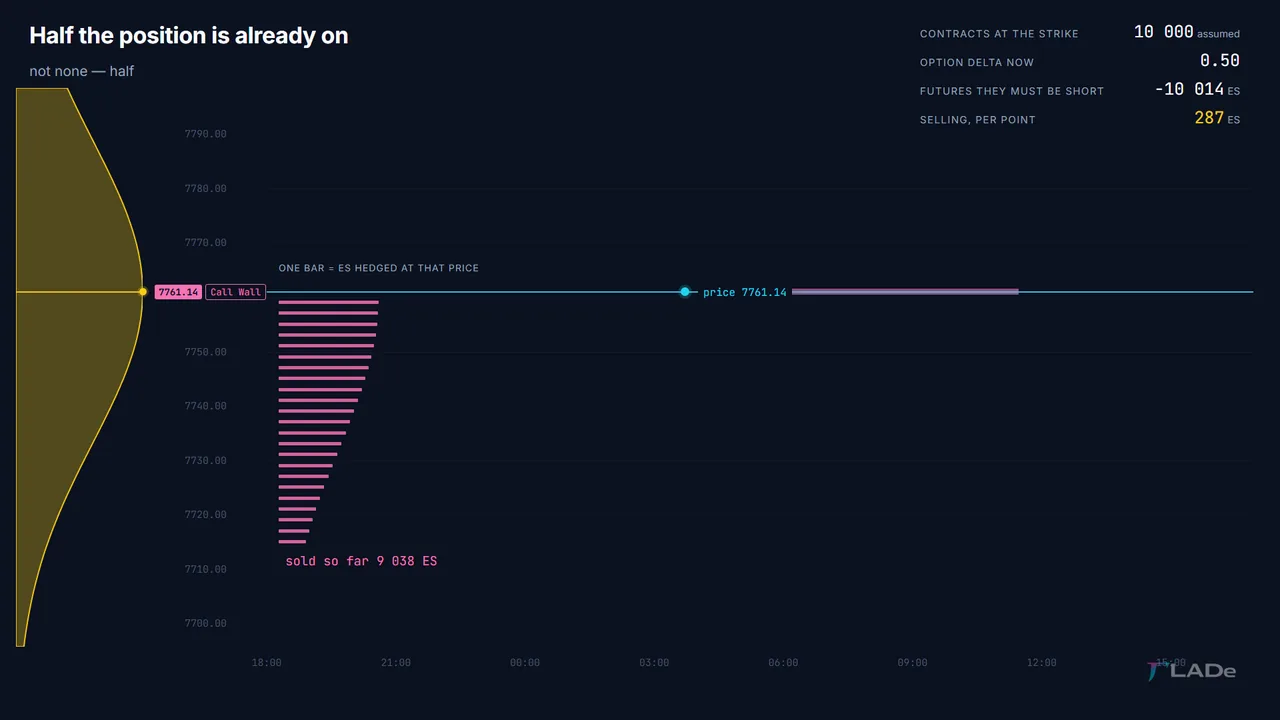
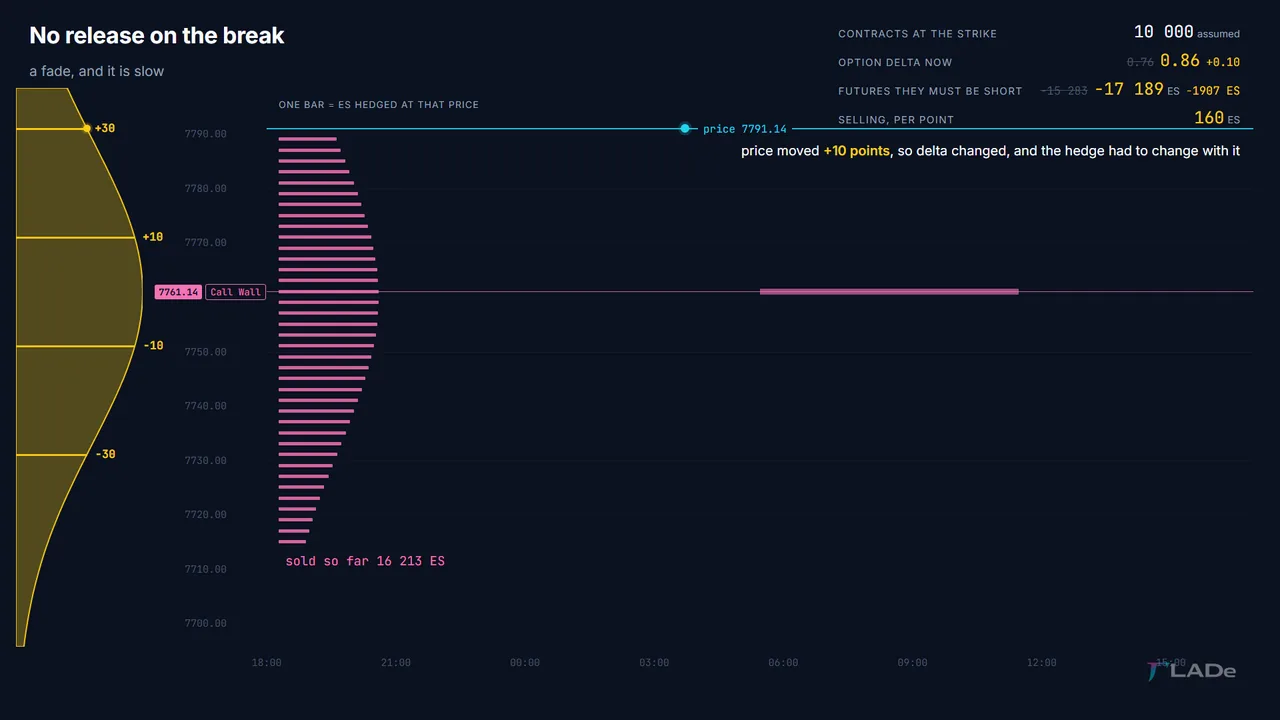
Past it: The rate does not stop at the line, it starts down the other side of the curve. One point beyond the strike it is the same size as one point before it. The desk goes on selling into the advance, slightly less at every further point, for tens of points. There is no release on the break. There is a fade, and it is slow.
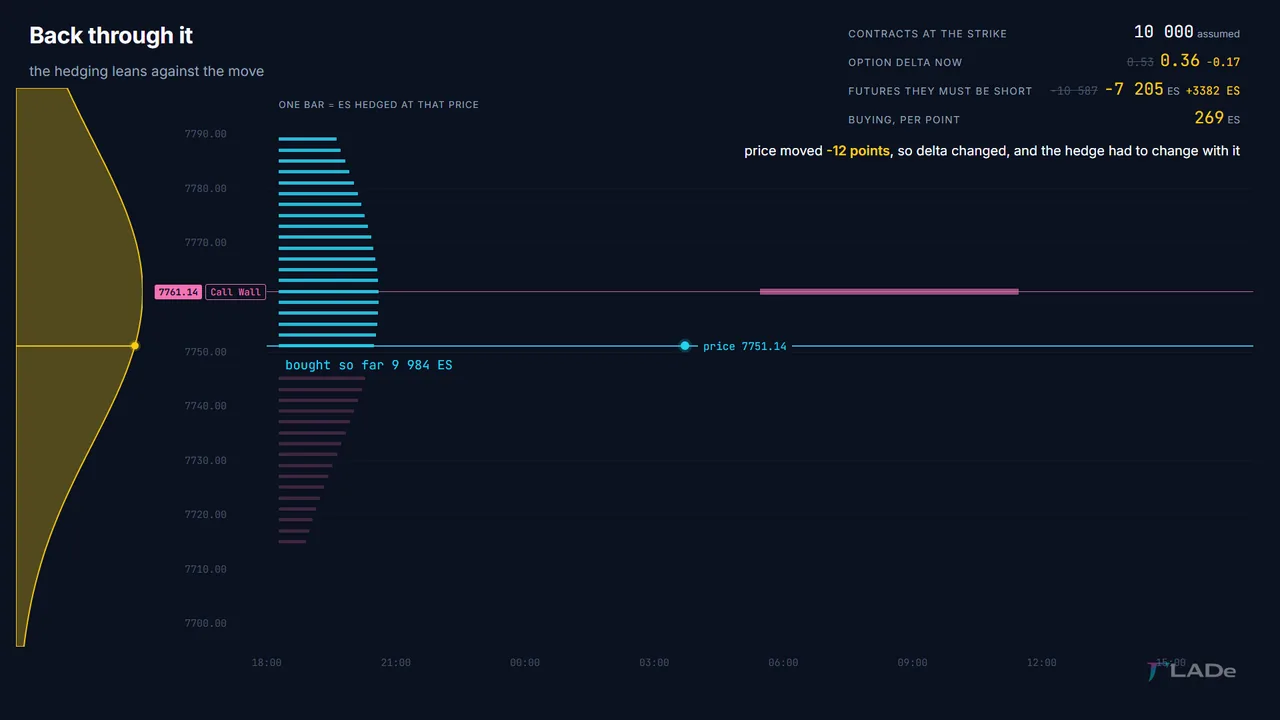
Back through it: The hedge has no memory. It is a function of where price is now, not of where price has been, so on the way back down the same arithmetic runs in reverse: delta falls, the desk buys back what it sold, point by point, at the same rate, largest at the strike again. Exactly what it sold, as long as the clock stands still. It never does, and what the clock does is coming up.
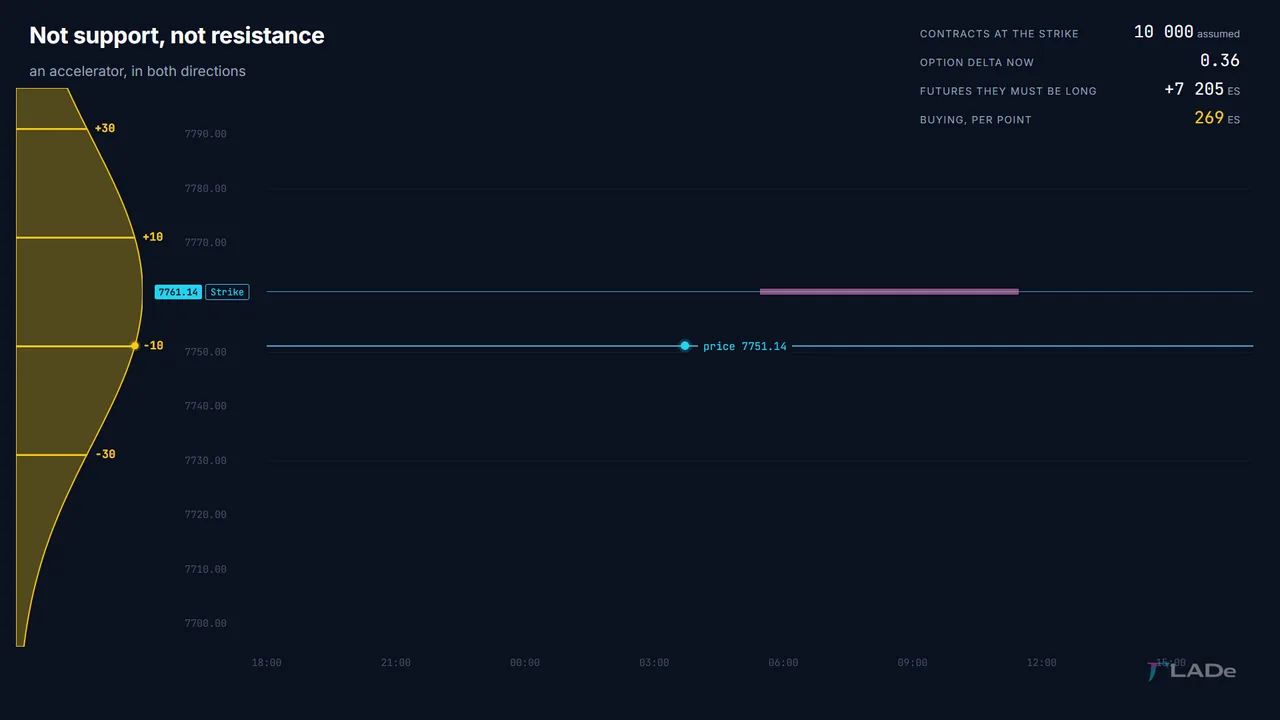
So when the sum is positive the level is neither a ceiling nor a floor. Any movement away from the strike is met by flow in the opposite direction, whichever way it goes, and that flow is strongest at the strike itself. Price can leave. It leaves against something, and the something peaks at the line.
Negative gamma: the same strike as an accelerator
Flip the sign — a desk that is short these options instead of long — and change nothing else. The four moments stay exactly where they are. Every direction in them reverses.
Coming up to it: Every point up forces buying, and each point forces more than the one before. The move is helping itself, and the help grows as the level gets closer.
At the strike: The maximum again — not the start of the acceleration, its peak. And the same half applies: half the position is already on by the time price touches the level.
Past it: The same fade, on the same side as the move. The desk keeps buying into the advance, slightly less at each further point, over tens of points.
Back through it: Reversed, and still with the move: coming back down, the forced flow is selling, largest at the strike. The retrace is helped too.
A negative sum around a heavy strike is not support and it is not resistance. It is an accelerator, and it works in both directions.
That is the whole microscope. The schedule is identical in both regimes — continuous, growing into the strike, peaking on it, fading past it, symmetric on the way back. The sign decides which way the forced flow points. It does not decide when any of it arrives, and in neither case is there a switch anywhere.
When calls and puts cancel at the heaviest strike
At some prices the two sides very nearly cancel. The calls contribute a large number, the puts contribute a large number, and what is left over after the subtraction is almost nothing — at a strike where the open interest is at its heaviest of the day. The net forced flow per point there is close to zero, by the same arithmetic that gave us everything above.
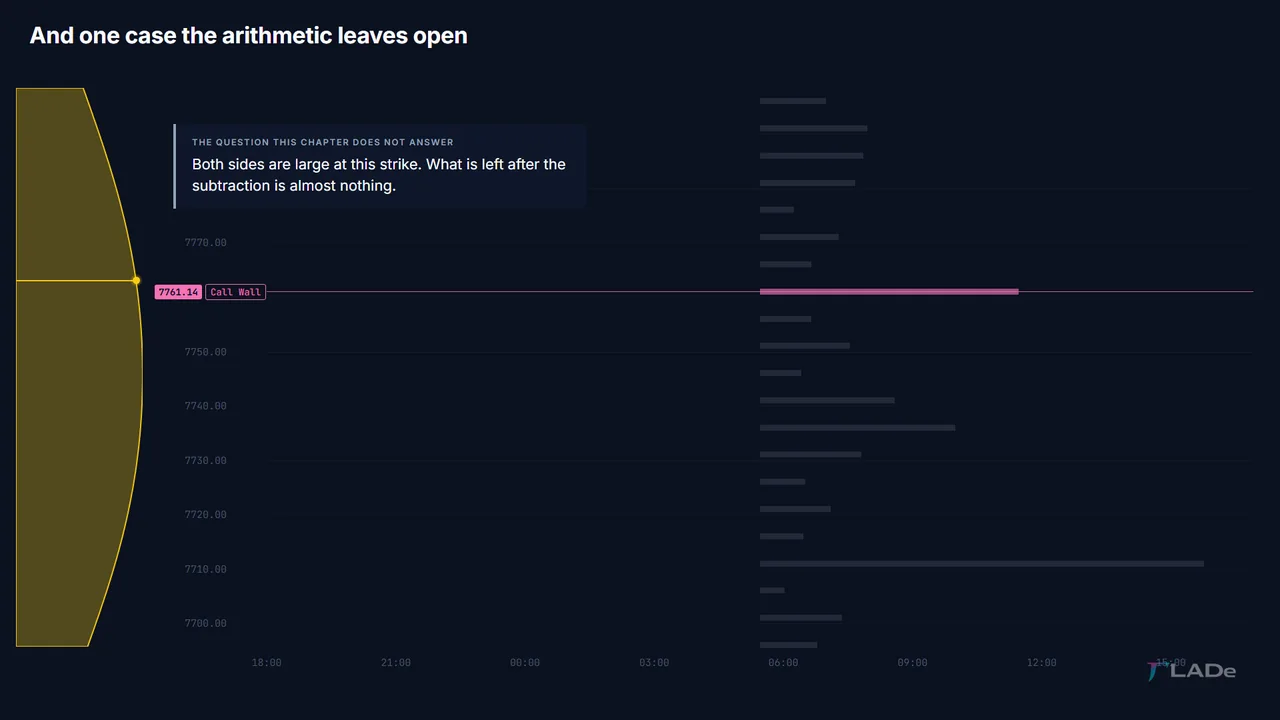
I am raising it and not answering it. It is not a corner case, it shows up on our own board, and any explanation of this data that never shows it to you is leaving something out.
Time to expiry: a zone in the morning, a spike in the afternoon
All four moments held the clock still. Let it move now, and hold price still instead.
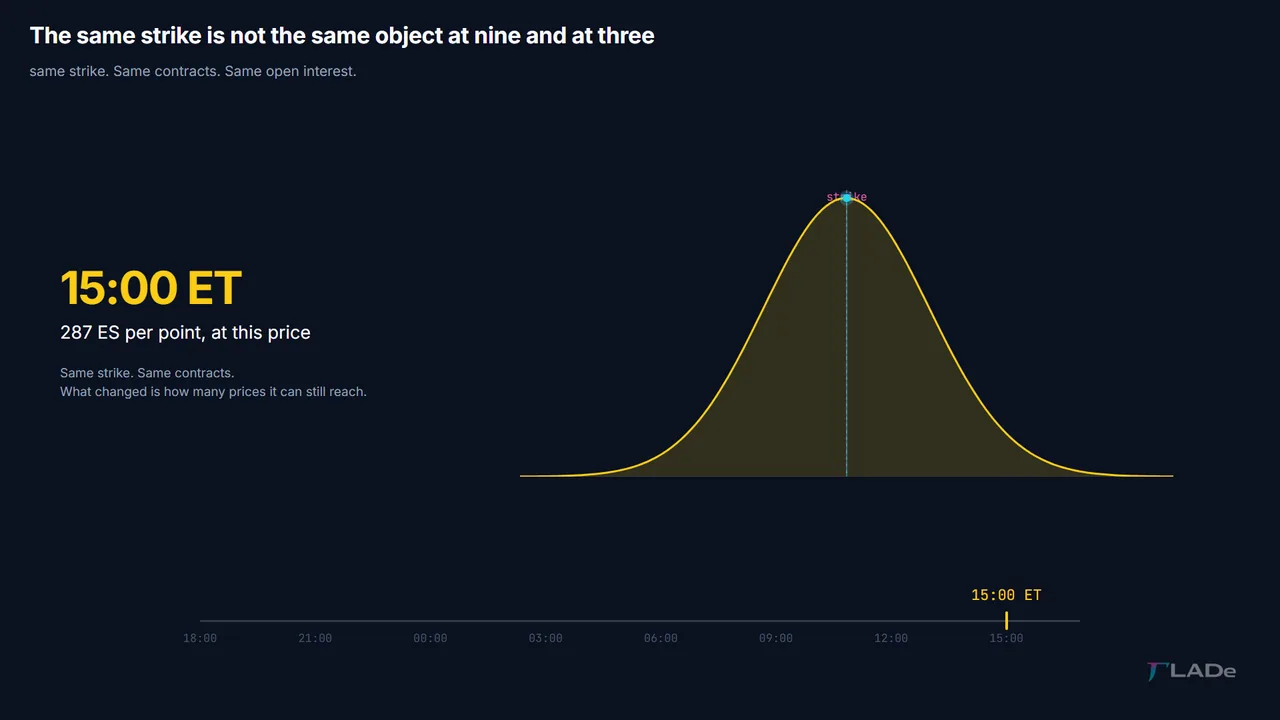
The curve has a width, and the width is set by time. A long way from expiry, the option could still end up almost anywhere, so its sensitivity is spread thin across a wide band of prices. Close to expiry it cannot — a handful of points decides it — so the same sensitivity is compressed into a narrow window around the strike.
Concretely, on a session with the VIX near fifteen. With the whole session still to run, thirty points away from a strike you are at about nine-tenths of the peak rate, and sixty points away still at seven-tenths: the whole screen is close to full strength. One hour before the close, thirty points away is down to a little over half, and sixty points away to about a tenth.
Same strike. Same contracts. Same open interest. In the morning it is a zone tens of points wide; in the afternoon it is a spike. Overnight, a strike is a zone tens of points wide, not a line. Judge it by the zone, not by the tick.
What dealer hedging can and cannot do to price
What it can do follows from the arithmetic and nothing else.
It can lean against moves, or lean with them, depending on the sign of the sum at that price. It can be concentrated: near expiry, the same open interest produces a far more violent flow per point, in a much smaller region. And it can simply be absent — outside the range of loaded strikes, there is nothing to hedge, and the mechanism has nothing to say.
What it cannot do is decide. Dealer hedging is a fraction of the volume in the futures. It is a participant who has to trade, mixed in with everybody who chooses to. A flow that has to happen bends the odds of what happens next. It does not write it.
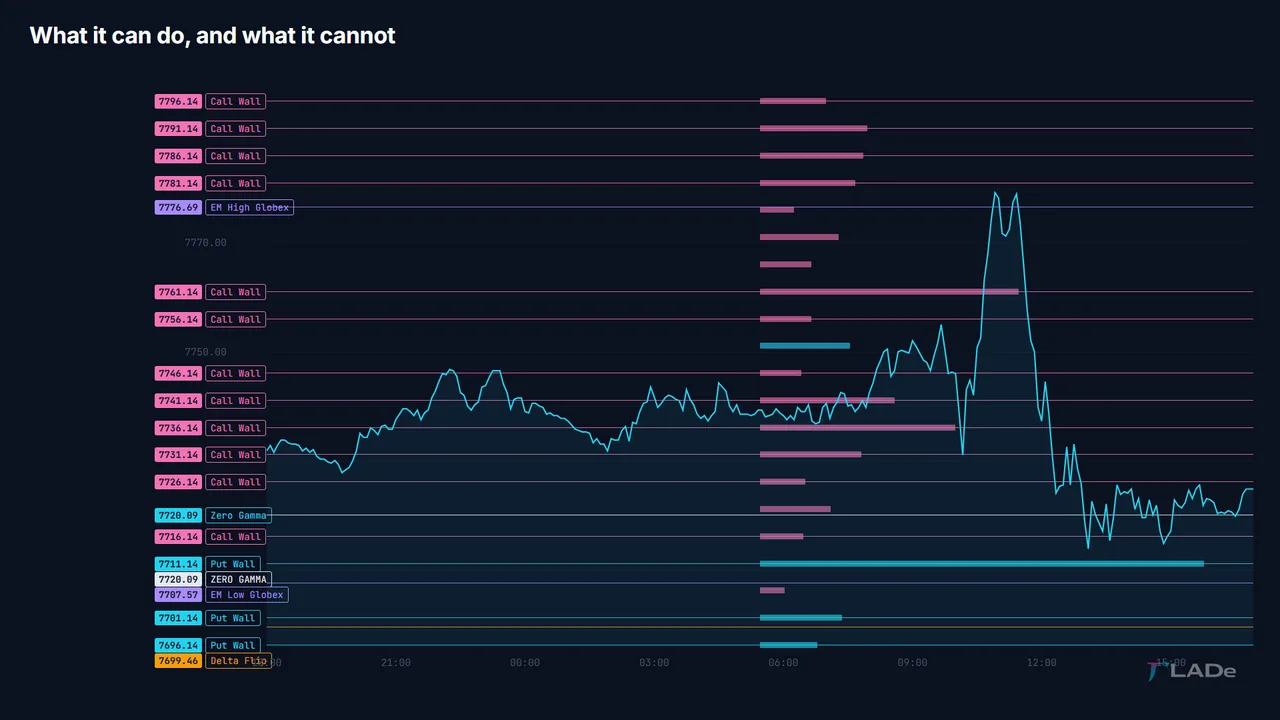
Which is why this chapter stops here. It has told you what is in the machine and how big it is. What any of it is worth at a given moment — whether it is the thing moving price today or a rounding error next to somebody with real size — is not a question the chain can answer.